|

GBP/USD Price Analysis: Stays firm despite retreating at 1.2800 as bears loom

  • GBP/USD maintains gains at 1.2786, up 0.14% from daily high.
  • Resistance trendline and overbought RSI hint at potential correction.
  • Short-term bearish engulfing pattern signals possible downward pressure.

The British Pound demonstrated its resilience against the Greenback on Tuesday, maintaining its gains as traders in the UK and the US returned after a long weekend. The GBP/USD is currently trading at 1.2786, showing a steady increase of 0.14% from its daily high of 1.2800.

GBP/USD Price Analysis: Technical outlook

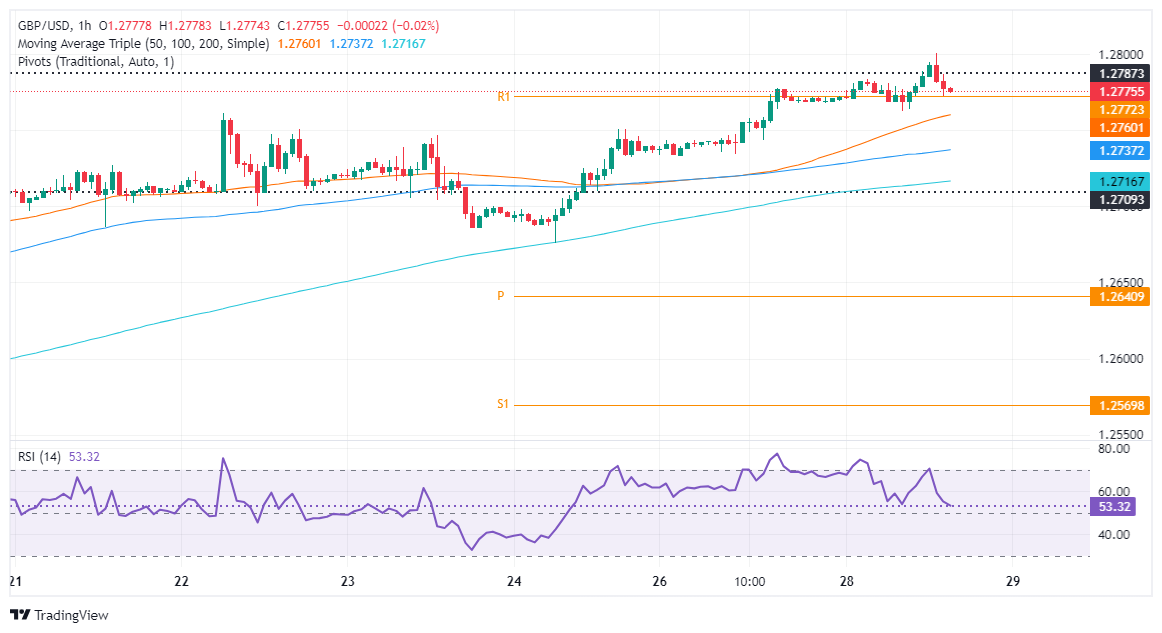
The GBP/USD tested the 1.2800 figure, yet a confluence of technical indicators with a downslope resistance trendline drawn from the highs of July 2023 and the March 21 cycle high at around 1.2803, pushed the exchange rate back to current spot prices. Momentum is in favor of buyers, but the Relative Strength Index (RSI) is about to turn overbought, hinting the pair could be headed for a correction.

In the short term, the GBP/USD hourly chart has formed a ‘bearish engulfing’ candle chart pattern, an indication that a leg-down is underway. Additionally, bullish momentum is fading as the Relative Strength Index (RSI) aims toward the 50 midline, which, once crossed, could exert downward pressure on the major.

Key support levels lie at the current day’s low of1.2762, followed by the confluence of the 50-simple moving average (SMA) at 1.2759, followed by the confluence of the100-SMA and the S1 pivot point at around 1.2736/39, ahead of the 200-SMA at 1.2716.

Conversely, if buyers stepped in and pushed prices above 1.2803, look for a re-test of the year-to-date (YTD) high of 1.2893.

GBP/USD Price Action – Hourly Chart

GBP/USD

Overview
Today last price1.2776
Today Daily Change0.0006
Today Daily Change %0.05
Today daily open1.277
 
Trends
Daily SMA201.2613
Daily SMA501.2582
Daily SMA1001.2634
Daily SMA2001.2541
 
Levels
Previous Daily High1.2778
Previous Daily Low1.2734
Previous Weekly High1.2761
Previous Weekly Low1.2676
Previous Monthly High1.2709
Previous Monthly Low1.23
Daily Fibonacci 38.2%1.2761
Daily Fibonacci 61.8%1.2751
Daily Pivot Point S11.2743
Daily Pivot Point S21.2716
Daily Pivot Point S31.2699
Daily Pivot Point R11.2787
Daily Pivot Point R21.2804
Daily Pivot Point R31.2831

Author

Christian Borjon Valencia

Christian Borjon began his career as a retail trader in 2010, mainly focused on technical analysis and strategies around it. He started as a swing trader, as he used to work in another industry unrelated to the financial markets.

More from Christian Borjon Valencia
Share:

Markets move fast. We move first.

Orange Juice Newsletter brings you expert driven insights - not headlines. Every day on your inbox.

By subscribing you agree to our Terms and conditions.

Editor's Picks

EUR/USD recovers to 1.1750 region as 2025 draws to a close

Following the bearish action seen in the European session on Wednesday, EUR/USD regains its traction and recovery to the 1.1750 region. Nevertheless, the pair's volatility remains low as trading conditions thin out on the last day of the year.

GBP/USD stays weak near 1.3450 on modest USD recovery

GBP/USD remains under modest beairsh pressure and fluctuates at around 1.3450 on Wednesday. The US Dollar finds fresh demand due to the end-of-the-year position adjustments, weighing on the pair amid the pre-New Year trading lull. 

Gold retreats to $4,300 area, looks to post monthly gains

Gold stays on the back foot on the last day of 2025 and trades near $4,300, possibly pressured by profit-taking and position adjustments. Nevertheless, XAU/USD remains on track to post gains for December and extend its winning streak into a fifth consecutive month.

Bitcoin, Ethereum and XRP prepare for a potential New Year rebound

Bitcoin, Ethereum, and Ripple are holding steady on Wednesday after recording minor gains on the previous day. Technically, Bitcoin could extend gains within a triangle pattern while Ethereum and Ripple face critical overhead resistance. 

Economic outlook 2026-2027 in advanced countries: Solidity test

After a year marked by global economic resilience and ending on a note of optimism, 2026 looks promising and could be a year of solid economic performance. In our baseline scenario, we expect most of the supportive factors at work in 2025 to continue to play a role in 2026.

Crypto market outlook for 2026

Year 2025 was volatile, as crypto often is.  Among positive catalysts were favourable regulatory changes in the U.S., rise of Digital Asset Treasuries (DAT), adoption of AI and tokenization of Real-World-Assets (RWA).