GBP/USD Price Analysis: Slides towards 1.2300 on trend line break
- GBP/USD bears are back in town after three-week uptrend as Cable news intraday low.
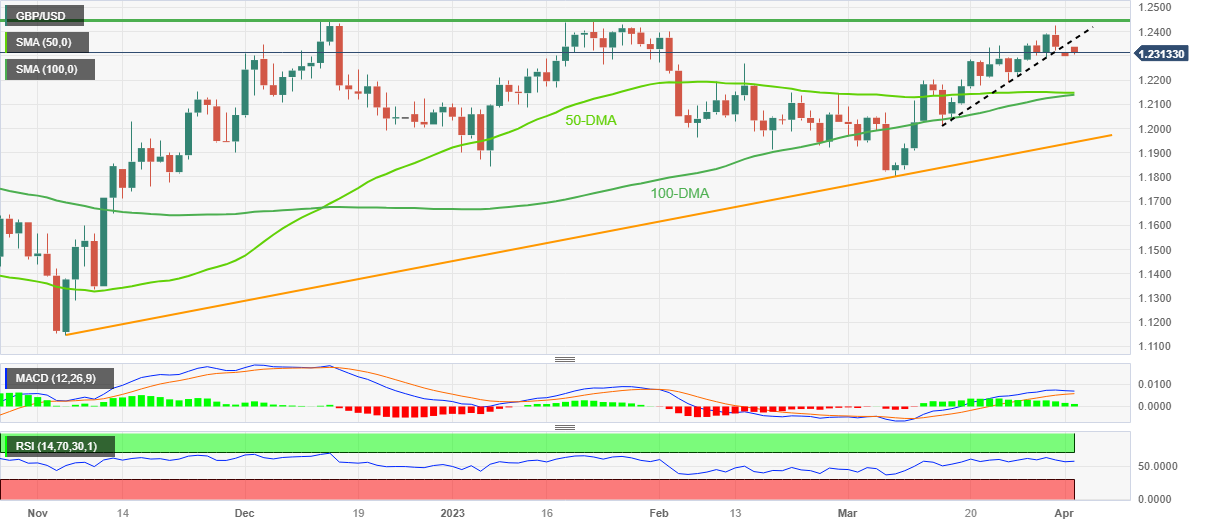
- Another failure to cross 1.2445-50 resistance zone, downside break of 13-day-old ascending support line lures sellers.
- Convergence of 50-DMA, 100-DMA appears the key support for bears to watch.
- Oscillators also suggest that buyers are running out of steam.

GBP/USD begins the week’s trading on a back foot after witnessing three consecutive weekly gains in the last, down 0.25% around 1.2310 by the press time.
In doing so, the Cable pair justifies the downside break of a two-week-old ascending support line, now resistance around 1.2365. Adding strength to the quote’s bearish bias is one more reversal from the 1.2445-50 resistance zone which has been restricting the quote’s upside since early December 2022.
Additionally, a looming bear cross on the MACD and a steady RSI (14) line also suggest that the GBP/USD pair could consolidate the latest weekly gains.
However, a convergence of the 50-DMA and 100-DMA, near 1.2140-45, appears a tough nut to crack for the Cable pair bears.
Following that, an upward-sloping support line from November, close to 1.1940 by the press time, can challenge the GBP/USD pair sellers.
Meanwhile, recovery moves not only need validation from the support-turned-resistance line of around 1.2365 but also need to provide a successful upside break of the 1.2445-50 area to convince the GBP/USD buyers.
Should the Cable pair manage to remain firmer past 1.2450, a run-up toward the May 2022 high of around 1.2665 can’t be ruled out.
GBP/USD: Daily chart
Trend: Further downside expected
Author

Anil Panchal
FXStreet
Anil Panchal has nearly 15 years of experience in tracking financial markets. With a keen interest in macroeconomics, Anil aptly tracks global news/updates and stays well-informed about the global financial moves and their implications.


