|

GBP/USD Price Analysis: Slides below 1.2000 amid modest USD strength, ahead of Fed’s Powell

  • GBP/USD retreats sharply from a four-day top amid the emergence of fresh USD buying.
  • A break below the 200-day SMA is needed to support prospects for any further downside.
  • Traders now look to Fed Chair Jerome Powell’s testimony for some meaningful impetus.

The GBP/USD pair comes under some renewed selling pressure following an early uptick to the 1.2065 area, or a multi-day top touched earlier this Tuesday and extends the downfall through the mid-European session. The pair slides back below the 1.2000 psychological mark in the last hour and is pressured by the emergence of fresh US Dollar buying.

Growing acceptance that the Federal Reserve will stick to its hawkish stance and keep interest rates higher for longer turn out to be a key factor that continues to act as a tailwind for the USD. Apart from this, looming recession risks further seem to benefit the Greenback's relative safe-haven status amid some repositioning trade ahead of Fed Chair Jerome Powell's semi-annual testimony before the Senate Banking Committee.

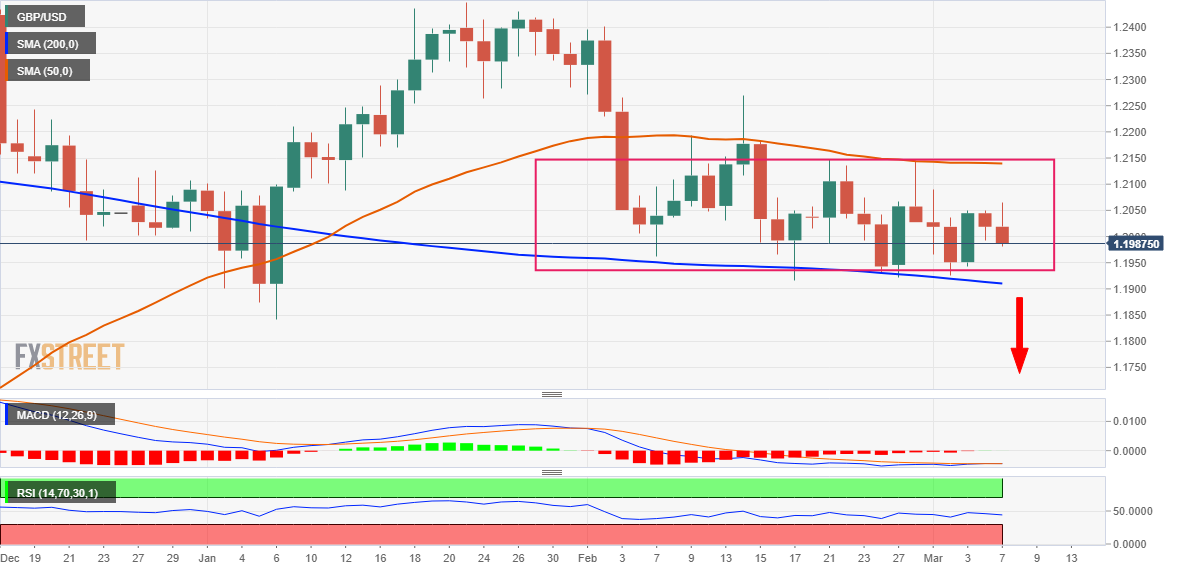
Looking at the broader picture, the two-way price moves witnessed over the past four weeks or so constitute the formation of a rectangle on the daily chart. The lower end of the trading band coincides with a technically significant 200-day Simple Moving Average (SMA). Bearish traders need to wait for a convincing break through the said support, currently pegged around the 1.1910 area, before placing fresh bets.

The GBP/USD pair might then turn vulnerable to accelerate the fall towards retesting the YTD low, around the 1.1840 region touched in January. Some follow-through selling will complete a bearish double-top pattern formation near the 1.2445-1.2450 area and pave the way for deeper losses. The downward trajectory could eventually drag spot prices below the 1.1800 mark, towards the 1.1725 support zone.

On the flip side, the daily swing high, around the 1.2065 area, now seems to act as an immediate barrier ahead of the 1.2100 mark. Any subsequent move-up could attract fresh sellers and remain capped near the 50-day SMA, around the 1.2135-1.2140 region. That said, a sustained strength beyond could lift the GBP/USD pair towards the 1.2200 mark en route to the February 14 peak, around the 1.2265-1.2270 zone.

GBP/USD daily chart

fxsoriginal

Key levels to watch

GBP/USD

Overview
Today last price1.1989
Today Daily Change-0.0030
Today Daily Change %-0.25
Today daily open1.2019
 
Trends
Daily SMA201.2047
Daily SMA501.214
Daily SMA1001.1992
Daily SMA2001.1913
 
Levels
Previous Daily High1.2049
Previous Daily Low1.1993
Previous Weekly High1.2143
Previous Weekly Low1.1922
Previous Monthly High1.2402
Previous Monthly Low1.1915
Daily Fibonacci 38.2%1.2014
Daily Fibonacci 61.8%1.2028
Daily Pivot Point S11.1992
Daily Pivot Point S21.1964
Daily Pivot Point S31.1936
Daily Pivot Point R11.2047
Daily Pivot Point R21.2076
Daily Pivot Point R31.2103

Author

Haresh Menghani

Haresh Menghani is a detail-oriented professional with 10+ years of extensive experience in analysing the global financial markets.

More from Haresh Menghani
Share:

Markets move fast. We move first.

Orange Juice Newsletter brings you expert driven insights - not headlines. Every day on your inbox.

By subscribing you agree to our Terms and conditions.

Editor's Picks

EUR/USD trims losses and returns to the 1.1750 area

The US Dollar resumed its decline in the American afternoon, helping EUR/USD trim early losses. The pair trades around 1.1750 as market participants gear up for the European Central Bank monetary policy decision and the United States Consumer Price Index.

GBP/USD consolidates above mid-1.3300s as traders await BoE and US CPI report

The GBP/USD pair struggles to capitalize on the overnight bounce from the 1.3310 area, or a one-week low, and oscillates in a narrow band during the Asian session on Thursday. Spot prices currently trade around the 1.3370 region, down less than 0.10% for the day, as traders opt to wait on the sidelines ahead of the key central bank event risk and US consumer inflation data.

Gold declines on profit-taking, USD strength ahead of US CPI release

Gold price edges lower below $4,350 during the Asian trading hours on Thursday. The precious metal retreats from seven-week highs amid some profit-taking and a rebound in the US Dollar (USD). The potential downside for the yellow metal might be limited after the recent US jobs data reinforce market expectations of further interest rate cuts by the US Federal Reserve and drag the USD lower. 

Top Crypto Losers: Pump.fun, SPX6900, Bittensor slide further with double-digit losses

Pump.fun, SPX6900, and Bittensor are leading the losses in the cryptocurrency market over the last 24 hours amid total liquidations of over $500 million. The retail segment alleges institutional manipulation amid an early-morning Bitcoin sell-off routine in the US market.

Monetary policy: Three central banks, three decisions, the same caution

While the Fed eased its monetary policy on 10 December for the third consecutive FOMC meeting, without making any guarantees about future action, the BoE, the ECB and the BoJ are holding their respective meetings this week. 

Crypto Today: Bitcoin, Ethereum, XRP slide further as risk-off sentiment deepens

Bitcoin faces extended pressure as institutional investors reduce their risk exposure. Ethereum’s upside capped at $3,000, weighed down by ETF outflows and bearish signals. XRP slides toward November’s support at $1.82 despite mild ETF inflows.