|

GBP/USD Price Analysis: Rises to near 1.2750 ahead of UK jobs data

  • GBP/USD could find resistance around the psychological level of 1.2800.
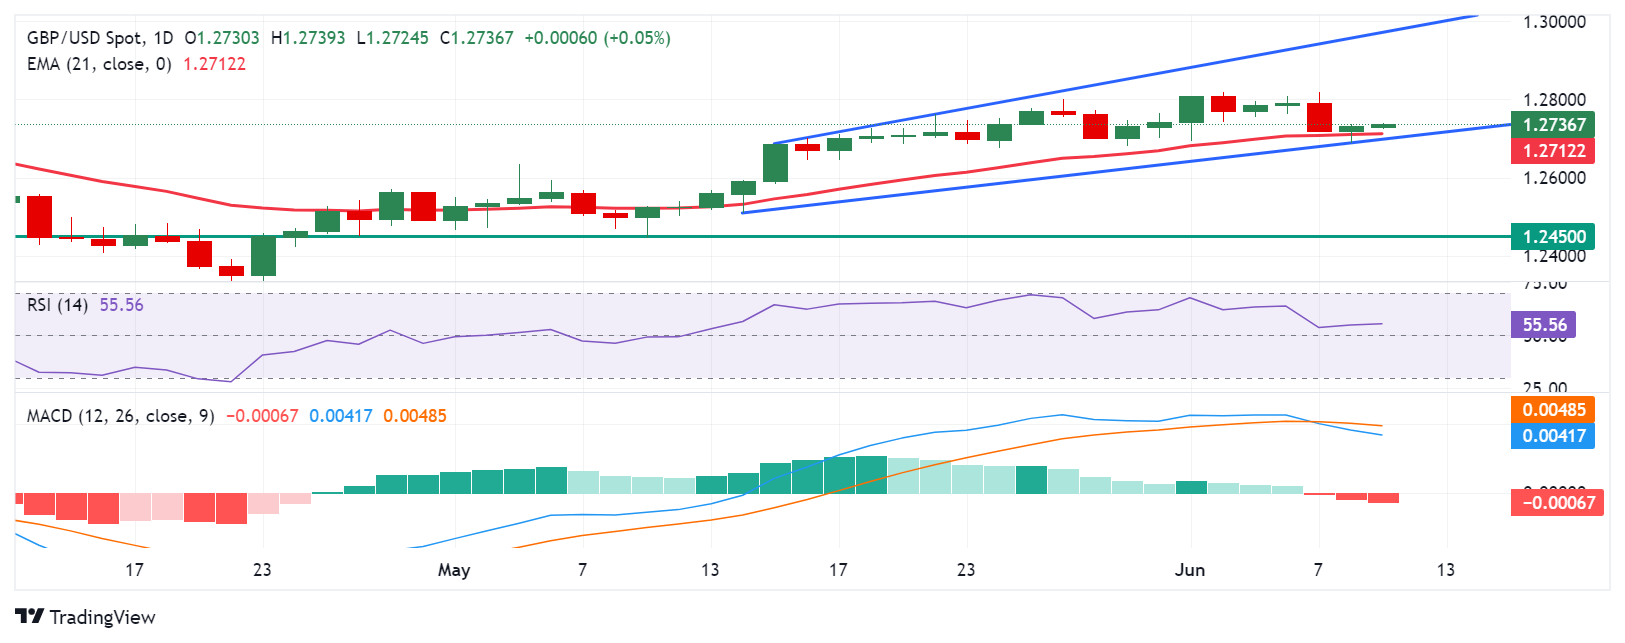
  • The momentum indicator MACD suggests a confirmation of a bullish trend for the pair.
  • The 21-day EMA at 1.2712 appears as the immediate support, followed by the lower boundary of the rising channel at 1.2700.

GBP/USD extends its gains for the second successive session ahead of employment data release from the United Kingdom (UK), trading around 1.2740 during the Asian session on Tuesday. The pair consolidates within the rising channel pattern on a daily chart, with the 14-day Relative Strength Index (RSI) positioned above the 50 level. indicating the bullish bias.

Additionally, the momentum indicator Moving Average Convergence Divergence (MACD) suggests a confirmation of the bullish trend as the MACD line is positioned above the centreline and shows divergence above the signal line.

The GBP/USD pair could find the key resistance around the psychological level of 1.2800. A breakthrough above this level could lead the pair to test the upper threshold of the rising channel around the level of 1.2970.

On the downside, the immediate support appears at the 21-day Exponential Moving Average (EMA) at 1.2712, followed by the lower boundary of the rising channel at 1.2700. A break below the latter could exert pressure on the GBP/USD pair to navigate the area around the throwback support at 1.2450.

GBP/USD: Daily Chart

GBP/USD

Overview
Today last price1.2738
Today Daily Change0.0007
Today Daily Change %0.05
Today daily open1.2731
 
Trends
Daily SMA201.2726
Daily SMA501.2603
Daily SMA1001.2638
Daily SMA2001.2546
 
Levels
Previous Daily High1.2737
Previous Daily Low1.2688
Previous Weekly High1.2818
Previous Weekly Low1.2695
Previous Monthly High1.2801
Previous Monthly Low1.2446
Daily Fibonacci 38.2%1.2719
Daily Fibonacci 61.8%1.2707
Daily Pivot Point S11.27
Daily Pivot Point S21.267
Daily Pivot Point S31.2651
Daily Pivot Point R11.2749
Daily Pivot Point R21.2768
Daily Pivot Point R31.2798

Author

Akhtar Faruqui

Akhtar Faruqui is a Forex Analyst based in New Delhi, India. With a keen eye for market trends and a passion for dissecting complex financial dynamics, he is dedicated to delivering accurate and insightful Forex news and analysis.

More from Akhtar Faruqui
Share:

Editor's Picks

AUD/USD eyes 0.7150 barrier nine-day EMA

AUD/USD inches higher after registering modest losses in the previous day, trading around 0.7130 during the Asian hours. The technical analysis of the daily chart indicates that the pair is moving sideways within the rectangle pattern, suggesting a consolidation as neither the bulls nor the bears have enough momentum to take control of the market.

USD/JPY trades below 160.00 intervention threshold; bullish bias intact

The USD/JPY pair attracts some sellers during the Asian session amid fears that authorities will step in again to prop up the Japanese Yen. Furthermore, the Israel-Lebanon truce prompts some profit-taking around the US Dollar and exerts downward pressure on the currency pair.

Gold defends 200-day SMA, rises toward $4,500

Gold is attempting a tepid recovery toward $4,500 on Thursday, as renewed optimism in the Mideast geopolitical front calms market nerves. This cautious optimism across Asian markets weighs on Oil prices, and diminishes the US Dollar’s safe-haven appeal, helping Gold stage a decent comeback from the weekly low of $4,424.


Hyperliquid: ETF demand, capital rotation fuel HYPE rally as Bitcoin melts

Hyperliquid price sustains an upward trend near its all-time high of $75.76 on Thursday after posting 80% gains in May, while Bitcoin (BTC) retraces below $65,000, triggering a market-wide panic.

Kevin Warsh takes the Fed helm: What it means for the US Dollar
The Federal Reserve moves away from the highly predictable "forward guidance" model of the Jerome Powell era to a new “Kevin Warsh environment”, characterized by less communication, more policy surprises, and an increased focus on the Fed's complex balance sheet.
Recession on paper: What really moves the Canadian Loonie now?

Statistics Canada handed the headline writers a gift and the analysts a headache. Real GDP shrank 0.1% on an annualized basis in the first quarter, and with the fourth quarter of 2025 revised down to a 1.0% contraction, that is two negative quarters in a row, the textbook definition of a technical recession and Canada's first since the pandemic.