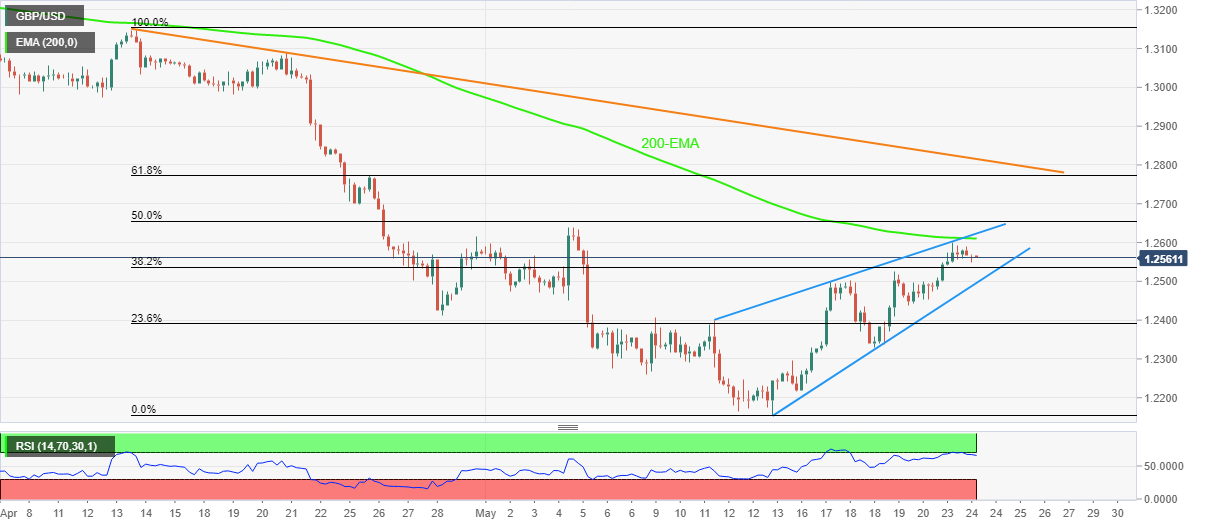
- GBP/USD retreats from 13-day top inside weekly rising wedge.
- 200-EMA, overbought RSI add strength to the pullback moves.
- Descending trend line from mid-April acts as extra filter to the north.
GBP/USD consolidates a three-day uptrend around a fortnight top, easing to 1.2565 ahead of Tuesday’s London open.
In doing so, the cable pair carries the previous day’s failure to cross the 200-EMA amid the overbought RSI (14) line.
However, the bears need a clear downside break of the 1.2500 threshold, comprising the support line of a weekly rising wedge bearish chart pattern, to retake control.
Following that, 1.2270 and the monthly low of 1.2155 can entertain traders ahead of the theoretical target surrounding 1.2050.
Meanwhile, recovery moves not only need to cross the 200-EMA level of 1.2610 but also cross the upper line of the stated wedge, near 1.2625, to favor the GBP/USD buyers.
In a case where the cable prices remain firmer past 1.2625, the 61.8% Fibonacci retracement of April-May fall and a five-week-old descending trend line, respectively around 1.2775 and 1.2815, will lure the bulls.
Overall, GBP/USD is likely to stay on the bear’s radar but validation from 1.2500 becomes necessary.
GBP/USD: Four-hour chart
Trend: Further weakness expected
Information on these pages contains forward-looking statements that involve risks and uncertainties. Markets and instruments profiled on this page are for informational purposes only and should not in any way come across as a recommendation to buy or sell in these assets. You should do your own thorough research before making any investment decisions. FXStreet does not in any way guarantee that this information is free from mistakes, errors, or material misstatements. It also does not guarantee that this information is of a timely nature. Investing in Open Markets involves a great deal of risk, including the loss of all or a portion of your investment, as well as emotional distress. All risks, losses and costs associated with investing, including total loss of principal, are your responsibility. The views and opinions expressed in this article are those of the authors and do not necessarily reflect the official policy or position of FXStreet nor its advertisers. The author will not be held responsible for information that is found at the end of links posted on this page.
If not otherwise explicitly mentioned in the body of the article, at the time of writing, the author has no position in any stock mentioned in this article and no business relationship with any company mentioned. The author has not received compensation for writing this article, other than from FXStreet.
FXStreet and the author do not provide personalized recommendations. The author makes no representations as to the accuracy, completeness, or suitability of this information. FXStreet and the author will not be liable for any errors, omissions or any losses, injuries or damages arising from this information and its display or use. Errors and omissions excepted.
The author and FXStreet are not registered investment advisors and nothing in this article is intended to be investment advice.
Recommended content
Editors’ Picks
AUD/USD bulls stay in the game and eye higher before correction

AUD/USD advanced mid-week and extended the gains on Thursday´s New York session as the US Dollar tumbled. AUD was helped by better China factory data and due to the hopes that the Federal Reserve will pause the rate hike.
EUR/USD bulls need validation from 100-day EMA and US NFP

EUR/USD seesaws around 1.0760 during Friday’s sluggish Asian session, after rising the most in nearly two months the previous day. In doing so, the Euro pair portrays the pre-NFP consolidation amid a cautious mood and a light calendar, as well as mixed technical catalysts.
Gold eyes a sustained break above $1,980 amid chaos over Fed’s rate guidance

Gold price has sensed marginal selling pressure after failing to sustain above the crucial resistance of $1,980.00 in the Asian session. The precious metal showed a solid upside on Thursday, capitalizing efficiently on a sell-off in the US Dollar Index (DXY).
Bitcoin price struggles below $27k while NASDAQ hits a 13-month high

Bitcoin price has had a pretty good run since the beginning of the year despite its ups and downs, but one of the most notable achievements was its decoupling from the stock markets. Although BTC initially experienced benefits from this, the past few days may seem to hold a contrary viewpoint.
The June rate hike needle has been moved precipitously lower

Even though equity market investors had, for the most part, looked through the debt ceiling drama, US stocks still rallied in relief rally fashion as investors revelled after perhaps one of the most significant economic downside risks of the year had been skirted.