|

GBP/USD Price Analysis: Remains under selling pressure, the key contention is seen at 1.2100

  • GBP/USD remains under selling pressure around 1.2133, bouncing off the lowest since March 17 of 1.2110.
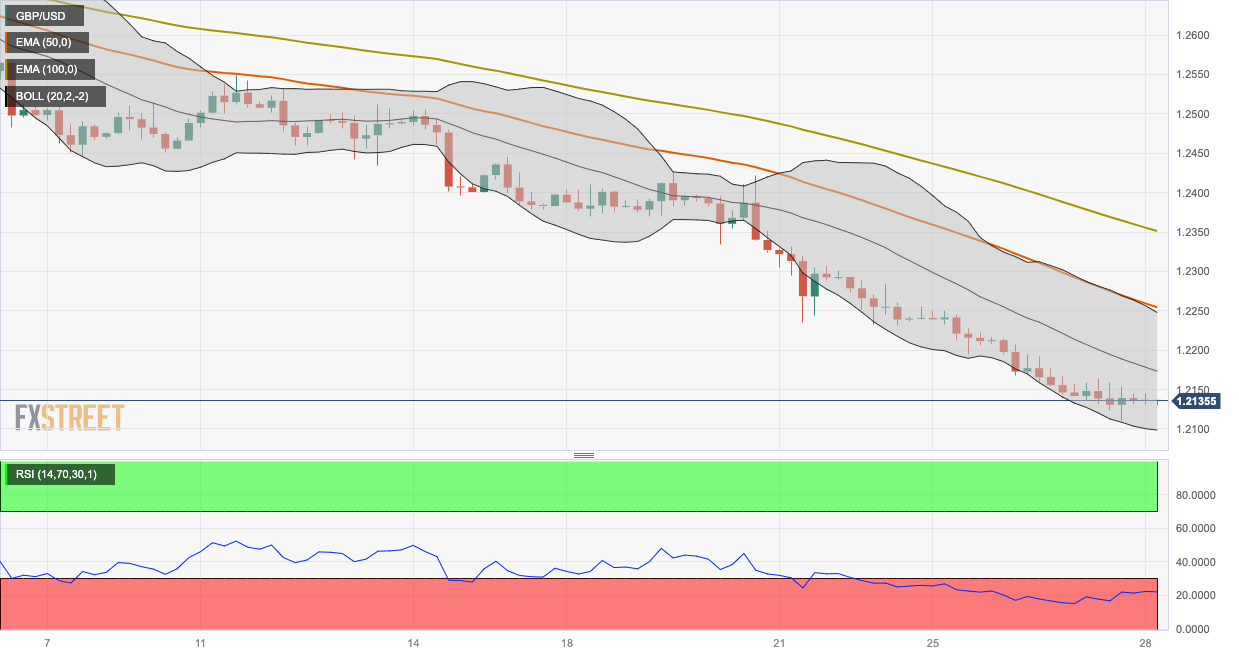
  • The pair holds below the 50- and 100-hour EMAs with the oversold RSI condition.
  • The key resistance level will emerge at 1.2250; 1.2100 will be the critical support level.

The GBP/USD pair extends its downside for the seventh consecutive day during the Asian session on Thursday. The downtick of the pair is supported by the firmer US Dollar (USD), higher Treasury Yield and upbeat US economic data. The pair currently trades near 1.2133, losing 0.02% on the day.

The Bank of England (BoE) unexpectedly paused its rate hike cycle while the Federal Reserve (Fed) offered hawkish remarks and signaled that rate additional rate hike is possible. The divergence of monetary policy between the BoE and Fed exerts pressure on the British Pound (GBP) and acts as a headwind for the GBP/USD pair.

According to the four-hour chart, GBP/USD holds below the 50- and 100-hour Exponential Moving Averages (EMAs) with a downward slope, which means further downside looks favorable. The Relative Strength Index (RSI) holds in bearish territory below 50. However, the oversold RSI condition indicates that further consolidation cannot be ruled out before positioning for any near-term GBP/USD depreciation.

The key resistance level for GBP/USD will emerge near the upper boundary of the Bollinger Band and the 50-hour EMA at 1.2250. The additional upside filter is located at 1.2351 (the 100-hour EMA). The next barrier to watch is near a high of September 21 at 1.2421, followed by a psychological round mark at 1.2500.

On the downside, 1.2100 will be the critical support level for the GBP/USD pair. The mentioned level is the confluence of the lower limit of the Bollinger Band, a psychological figure, and a low of March 17. Further south, the next stop is located at 1.2025 (a low of March 16). Any intraday pullback below the latter would expose the next downside stop at 1.2000 (a round mark).

GBP/USD four-hour chart

GBP/USD

Overview
Today last price1.2134
Today Daily Change-0.0001
Today Daily Change %-0.01
Today daily open1.2135
 
Trends
Daily SMA201.2417
Daily SMA501.2615
Daily SMA1001.2629
Daily SMA2001.2435
 
Levels
Previous Daily High1.2166
Previous Daily Low1.2111
Previous Weekly High1.2425
Previous Weekly Low1.2231
Previous Monthly High1.2841
Previous Monthly Low1.2548
Daily Fibonacci 38.2%1.2132
Daily Fibonacci 61.8%1.2145
Daily Pivot Point S11.2108
Daily Pivot Point S21.2082
Daily Pivot Point S31.2053
Daily Pivot Point R11.2164
Daily Pivot Point R21.2193
Daily Pivot Point R31.222

Author

Lallalit Srijandorn

Lallalit Srijandorn is a Parisian at heart. She has lived in France since 2019 and now becomes a digital entrepreneur based in Paris and Bangkok.

More from Lallalit Srijandorn
Share:

Markets move fast. We move first.

Orange Juice Newsletter brings you expert driven insights - not headlines. Every day on your inbox.

By subscribing you agree to our Terms and conditions.

Editor's Picks

EUR/USD rebounds after falling toward 1.1700

EUR/USD gains traction and trades above 1.1730 in the American session, looking to end the week virtually unchanged. The bullish opening in Wall Street makes it difficult for the US Dollar to preserve its recovery momentum and helps the pair rebound heading into the weekend.

GBP/USD steadies below 1.3400 as traders assess BoE policy outlook

Following Thursday's volatile session, GBP/USD moves sideways below 1.3400 on Friday. Investors reassess the Bank of England's policy oıtlook after the MPC decided to cut the interest rate by 25 bps by a slim margin. Meanwhile, the improving risk mood helps the pair hold its ground.

Gold stays below $4,350, looks to post small weekly gains

Gold struggles to gather recovery momentum and stays below $4,350 in the second half of the day on Friday, as the benchmark 10-year US Treasury bond yield edges higher. Nevertheless, the precious metal remains on track to end the week with modest gains as markets gear up for the holiday season.

Crypto Today: Bitcoin, Ethereum, XRP rebound amid bearish market conditions

Bitcoin (BTC) is edging higher, trading above $88,000 at the time of writing on Monday. Altcoins, including Ethereum (ETH) and Ripple (XRP), are following in BTC’s footsteps, experiencing relief rebounds following a volatile week.

How much can one month of soft inflation change the Fed’s mind?

One month of softer inflation data is rarely enough to shift Federal Reserve policy on its own, but in a market highly sensitive to every data point, even a single reading can reshape expectations. November’s inflation report offered a welcome sign of cooling price pressures. 

XRP rebounds amid ETF inflows and declining retail demand demand

XRP rebounds as bulls target a short-term breakout above $2.00 on Friday. XRP ETFs record the highest inflow since December 8, signaling growing institutional appetite.