GBP/USD Price Analysis: Remains confined in a range, just above mid-1.2800s


  • GBP/USD gained traction for the second consecutive session on Tuesday.
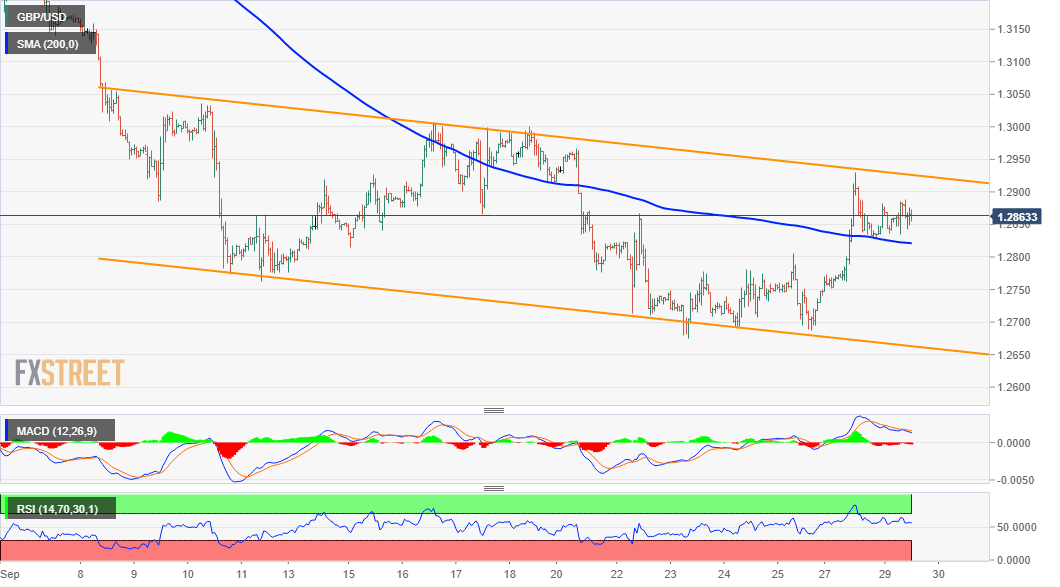
  • The upside remains capped near a three-week-old trend-channel hurdle.
  • Dips towards 200-hour SMA might still be seen as a buying opportunity.

The GBP/USD pair edged higher for the second consecutive session on Tuesday, albeit lacked any strong follow-through and remained well within the previous day's broader trading range.

Looking at the technical picture, the overnight strong positive move stalled near a resistance marked by the top end of a near three-week-old descending channel. The pullback, however, remained limited and attracted some dip-buying near 200-hour SMA, which should now act as a key pivotal point for intraday traders.

Meanwhile, technical indicators on hourly charts maintained their bullish bias and have been recovering from the negative territory on the daily chart. The set-up supports prospects for an eventual breakthrough the trend-channel resistance, though bulls seemed to wait for Brexit updates before placing fresh bets.

That said, some follow-through buying beyond the previous day’s swing high, around the 1.2930 region, should pave the way for a move towards conquering the key 1.3000 psychological mark. A subsequent strength beyond 50-day SMA, around the 1.3025-30 region, will be seen as a fresh trigger for bullish traders.

On the flip side, the 200-hour SMA, around the 1.2820 region, might continue to protect the immediate downside. This is followed by the 1.2800 mark and support near the 1.2775 region. Failure to defend the mentioned support levels will negate prospects for any further near-term appreciating move.

The pair might then accelerate the fall back towards the 1.2700 mark before eventually dropping to multi-week lows, around the 1.2675 region, en-route the trend-channel support. A convincing break below will set the stage for the resumption of the recent sharp decline and drag the pair further below the 1.2600 mark.

GBP/USD 1-hourly chart

fxsoriginal

Technical levels to watch

GBP/USD

Overview
Today last price 1.2863
Today Daily Change 0.0029
Today Daily Change % 0.23
Today daily open 1.2834
 
Trends
Daily SMA20 1.2962
Daily SMA50 1.3022
Daily SMA100 1.2738
Daily SMA200 1.272
 
Levels
Previous Daily High 1.293
Previous Daily Low 1.2747
Previous Weekly High 1.2967
Previous Weekly Low 1.2676
Previous Monthly High 1.3396
Previous Monthly Low 1.2982
Daily Fibonacci 38.2% 1.286
Daily Fibonacci 61.8% 1.2817
Daily Pivot Point S1 1.2744
Daily Pivot Point S2 1.2654
Daily Pivot Point S3 1.2561
Daily Pivot Point R1 1.2927
Daily Pivot Point R2 1.302
Daily Pivot Point R3 1.3111


Share: Feed news

Information on these pages contains forward-looking statements that involve risks and uncertainties. Markets and instruments profiled on this page are for informational purposes only and should not in any way come across as a recommendation to buy or sell in these assets. You should do your own thorough research before making any investment decisions. FXStreet does not in any way guarantee that this information is free from mistakes, errors, or material misstatements. It also does not guarantee that this information is of a timely nature. Investing in Open Markets involves a great deal of risk, including the loss of all or a portion of your investment, as well as emotional distress. All risks, losses and costs associated with investing, including total loss of principal, are your responsibility. The views and opinions expressed in this article are those of the authors and do not necessarily reflect the official policy or position of FXStreet nor its advertisers. The author will not be held responsible for information that is found at the end of links posted on this page.

If not otherwise explicitly mentioned in the body of the article, at the time of writing, the author has no position in any stock mentioned in this article and no business relationship with any company mentioned. The author has not received compensation for writing this article, other than from FXStreet.

FXStreet and the author do not provide personalized recommendations. The author makes no representations as to the accuracy, completeness, or suitability of this information. FXStreet and the author will not be liable for any errors, omissions or any losses, injuries or damages arising from this information and its display or use. Errors and omissions excepted.

The author and FXStreet are not registered investment advisors and nothing in this article is intended to be investment advice.

Recommended content


Recommended content

Editors’ Picks

EUR/USD fluctuates near 1.0700 after US data

EUR/USD fluctuates near 1.0700 after US data

EUR/USD stays in a consolidation phase at around 1.0700 in the American session on Wednesday. The data from the US showed a strong increase in Durable Goods Orders, supporting the USD and making it difficult for the pair to gain traction.

EUR/USD News

USD/JPY refreshes 34-year high, attacks 155.00 as intervention risks loom

USD/JPY refreshes 34-year high, attacks 155.00 as intervention risks loom

USD/JPY is renewing a multi-decade high, closing in on 155.00. Traders turn cautious on heightened risks of Japan's FX intervention. Broad US Dollar rebound aids the upside in the major. US Durable Goods data are next on tap. 

USD/JPY News

Gold keeps consolidating ahead of US first-tier figures

Gold keeps consolidating ahead of US first-tier figures

Gold finds it difficult to stage a rebound midweek following Monday's sharp decline but manages to hold above $2,300. The benchmark 10-year US Treasury bond yield stays in the green above 4.6% after US data, not allowing the pair to turn north.

Gold News

Worldcoin looks set for comeback despite Nvidia’s 22% crash Premium

Worldcoin looks set for comeback despite Nvidia’s 22% crash

Worldcoin price is in a better position than last week's and shows signs of a potential comeback. This development occurs amid the sharp decline in the valuation of the popular GPU manufacturer Nvidia.

Read more

Three fundamentals for the week: US GDP, BoJ and the Fed's favorite inflation gauge stand out Premium

Three fundamentals for the week: US GDP, BoJ and the Fed's favorite inflation gauge stand out

While it is hard to predict when geopolitical news erupts, the level of tension is lower – allowing for key data to have its say. This week's US figures are set to shape the Federal Reserve's decision next week – and the Bank of Japan may struggle to halt the Yen's deterioration. 

Read more

Forex MAJORS

Cryptocurrencies

Signatures