|

GBP/USD Price Analysis: Rebounds at 37-year lows, reclaims the 1.1500 figure

  • GBP/USD is recording decent gains after nosediving to a 1985 daily low.
  • The British pound found some base around 1.1400, rallying more than 130-pips on the day.
  • The major might record a leg-up before extending its fall for a re-test of the YTD low at a1.1406.

The GBP/USD refreshed a 37-year low but bounced off and reclaimed the 1.1500 figure after meandering around the 1.1400 round figure during the day. The GBP/USD recovered some ground and settled at current exchange rates, trading at 1.1531, above its opening price by 0.18%, at the time of writing.

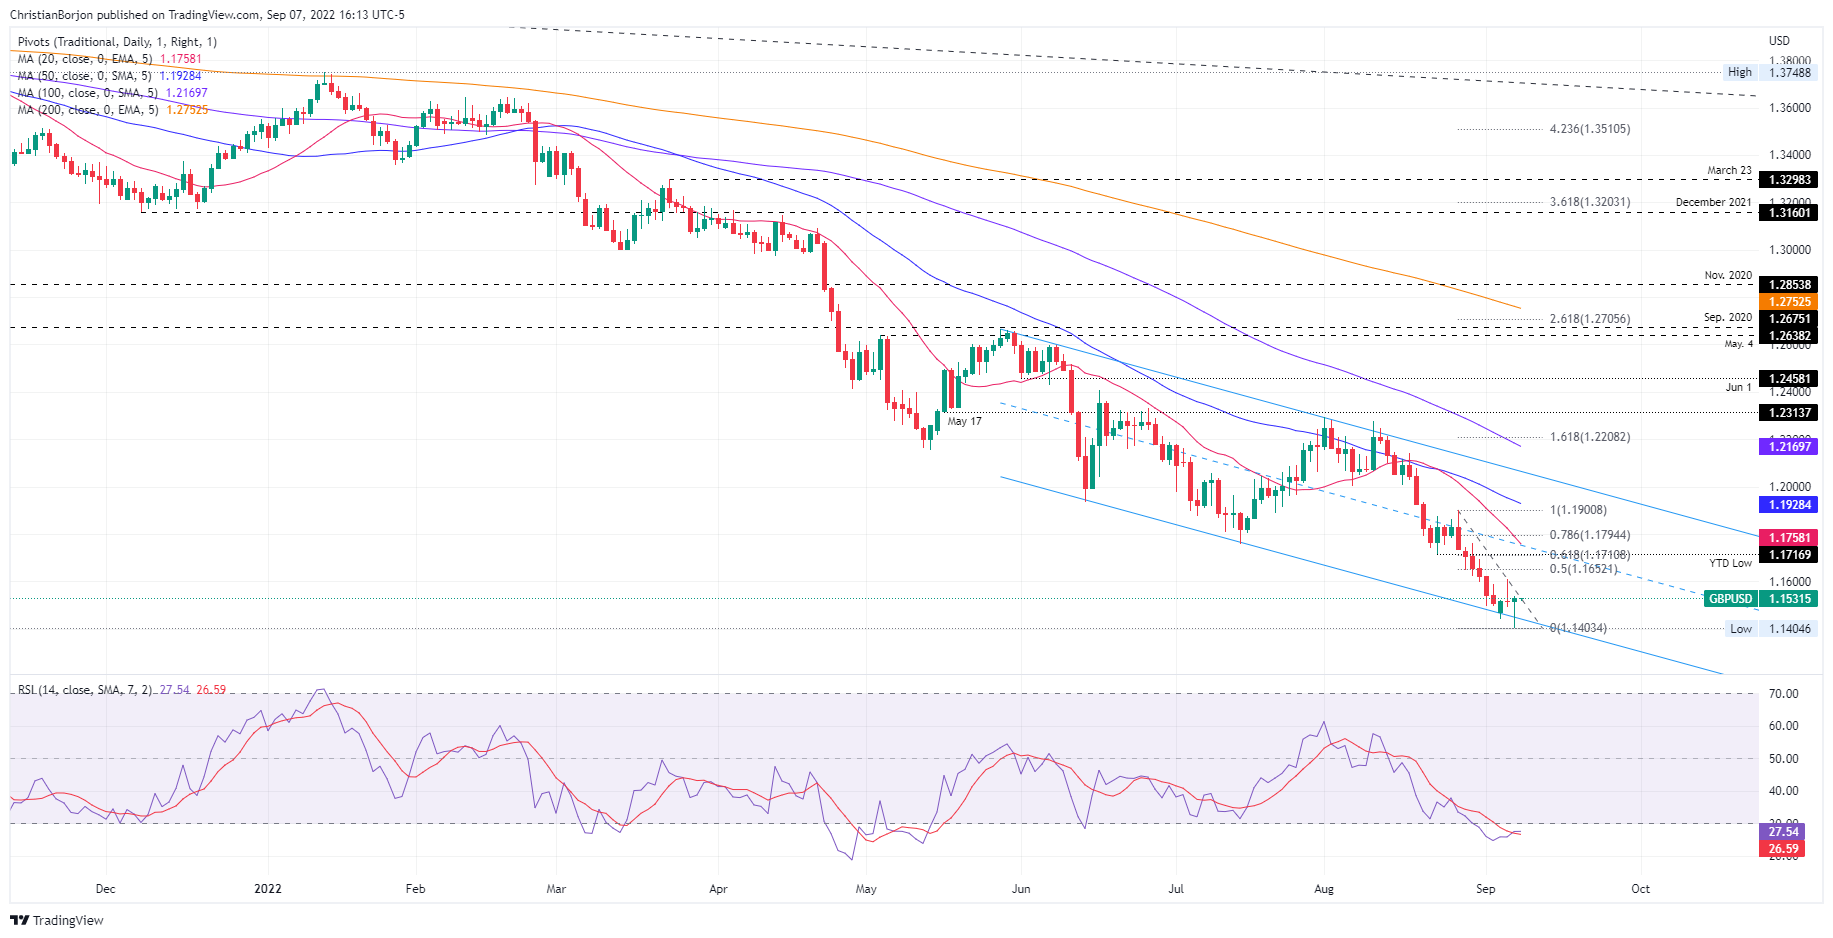
GBP/USD Price Analysis: Technical outlook

The GBP/USD trades were volatile during Wednesday’s trading session. The major is still downward biased, despite recovering more than 100-pips losses. It is worth noting that the Sterling dropped below the descending channel, where the major has been trading since late May, when the British pound began its downfall throughout 2022.

GBP traders should know that the Relative Strength Index (RSI) is within the oversold territory, so the pair might print a leg-up before resuming its downward path. Therefore, the GBP/USD’s first resistance would be the September 6 daily high at 1.1608. Once cleared, the next supply zone would be the 50% Fibonacci retracement at 1.1652, followed by the 61.8% Fibonacci level at 1.1710.

On the downside, the GBP/USD first floor would be the 1.1500 figure. The break below will expose the YTD low at 1.1400, followed by the psychological 1.1300 figure.

GBP/USD Key Technical Levels

GBP/USD

Overview
Today last price1.1531
Today Daily Change0.0005
Today Daily Change %0.04
Today daily open1.1521
 
Trends
Daily SMA201.1828
Daily SMA501.1956
Daily SMA1001.2203
Daily SMA2001.2773
 
Levels
Previous Daily High1.1609
Previous Daily Low1.1494
Previous Weekly High1.1761
Previous Weekly Low1.1496
Previous Monthly High1.2294
Previous Monthly Low1.1599
Daily Fibonacci 38.2%1.1565
Daily Fibonacci 61.8%1.1538
Daily Pivot Point S11.1473
Daily Pivot Point S21.1426
Daily Pivot Point S31.1358
Daily Pivot Point R11.1589
Daily Pivot Point R21.1657
Daily Pivot Point R31.1705

Author

Christian Borjon Valencia

Markets analyst, news editor, and trading instructor with over 14 years of experience across FX, commodities, US equity indices, and global macro markets.

More from Christian Borjon Valencia
Share:

Editor's Picks

AUD/USD falls to near 0.7100 after slipping below 50-day EMA

AUD/USD depreciates after registering minor gains in the previous day, trading around 0.7120 during the Asian hours. The technical analysis of the daily chart shows the pair consolidating sideways within a rectangle pattern, as neither bulls nor bears gain control. The AUD/USD pair is holding a slight bearish tone however as it sits beneath both the nine-day and 50-day EMAs.

160.00: USD/JPY back near intervention territory after upbeat US jobs report

US Nonfarm Payrolls beat expectations by a wide margin in May, with 172K jobs added. The US Dollar rebounds after the release, helping USD/JPY recover from its intraday lows. Warnings from Japanese authorities continue to limit upside potential near the 160.00 threshold.

Gold targets $4,300 amid stronger Dollar

Gold faces increasing selling interest and navigates the area of three-month lows near the $4,300 mark per troy ounce on Friday. The precious metal’s decline comes as traders assess the stronger-than-expected NFP, while the bid bias in the Greenback and higher US Treasury yields also collaborate with the retracement.

Cardano hits five-year low even as Hoskinson clarifies "break" isn't an exit

Cardano (ADA) price is down 10% at press time on Friday, extending losses over 30% so far this week amid Charles Hoskinson's clarification that "break" isn't an exit.

Week ahead – Fed countdown begins amid US inflation data and geopolitical risks

Fed Chair Warsh’s first meeting approaches as key US inflation data could reshape expectations. Oil prices remain elevated as US-Iran talks continue; tariffs also return to the spotlight. ECB is expected to hike; will it be a one-off move or is July live?

The US economy defies the rules: 100 days into the Oil shock and the recession signal is still missing

More than three months after the start of the Iran war and the resulting disruption to global energy markets, the US economy continues to display remarkable resilience. The conflict has triggered a sharp rise in Oil prices, reignited inflationary pressures and fueled widespread concerns about a potential economic slowdown.