GBP/USD Price Analysis: Rallies above 1.2800 as buyers gain momentum
- GBP/USD soared more than 0.70% on Wednesday, post-CPI, ahead of FOMC’s decision.
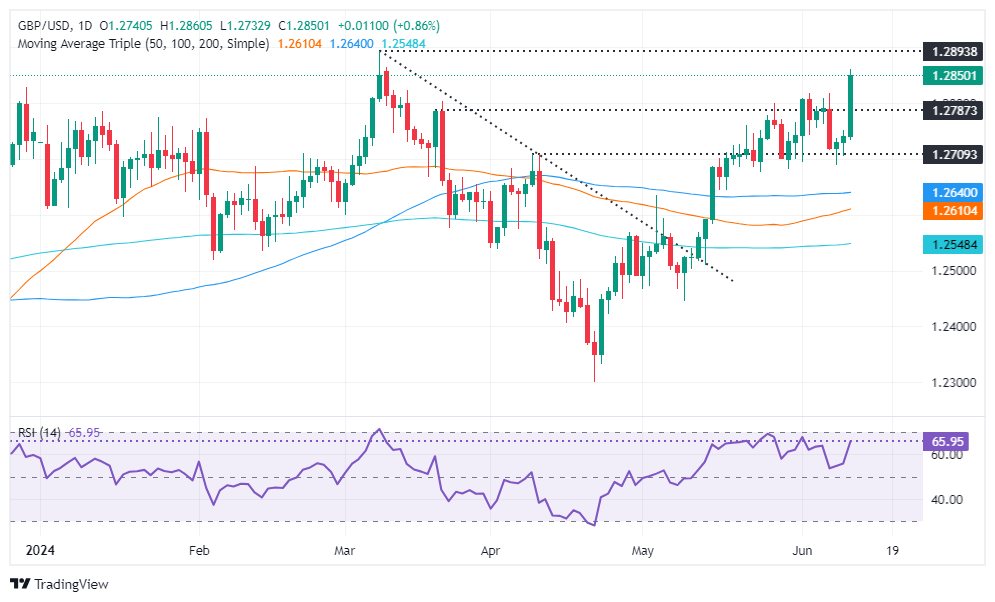
- Key technical resistance lies at YTD highs of 1.2893, 1.2900, and the 1.3000 figure.
- Sellers must push prices beneath 1.2800, to remain hopeful of lower prices.

The Pound Sterling recovered some ground versus the US Dollar in early trading on Wednesday after the US Department of Labor revealed that inflation is cooling in the United States. This development happened ahead of the Federal Reserve's monetary policy decision, which would be followed by Fed Chair Jerome Powell's press conference. Therefore, the GBP/USD hit a two-month high and traded at 1.28434, gaining more than 0.70%.
GBP/USD Price Analysis: Technical outlook
The GBP/USD remains upward biased, and after the US inflation data, has broken to new two-month highs, with just the year-to-date (YTD) high lying ahead at 1.2893. Once cleared, the next stop would be 1.3000 before challenging last year's high of 1.3142.
Momentum shifts strongly bullish, as depicted by the Relative Strength Index (RSI), which aims upward toward becoming overbought. Yet it remains shy of the highest RSI peak of 72.
If sellers want to regain control, they must drag the GBP/USD below 1.2800. Once surpassed, the next support would be 1.2750, ahead of the current week’s low of 1.2687.
GBP/USD Price Action – Daily Chart
British Pound PRICE Today
The table below shows the percentage change of British Pound (GBP) against listed major currencies today. British Pound was the strongest against the US Dollar.
| USD | EUR | GBP | JPY | CAD | AUD | NZD | CHF | |
|---|---|---|---|---|---|---|---|---|
| USD | -0.98% | -0.86% | -0.81% | -0.56% | -1.36% | -1.22% | -0.76% | |
| EUR | 0.98% | 0.12% | 0.14% | 0.39% | -0.40% | -0.24% | 0.23% | |
| GBP | 0.86% | -0.12% | 0.04% | 0.29% | -0.49% | -0.34% | 0.10% | |
| JPY | 0.81% | -0.14% | -0.04% | 0.24% | -0.55% | -0.40% | 0.05% | |
| CAD | 0.56% | -0.39% | -0.29% | -0.24% | -0.80% | -0.63% | -0.20% | |
| AUD | 1.36% | 0.40% | 0.49% | 0.55% | 0.80% | 0.16% | 0.63% | |
| NZD | 1.22% | 0.24% | 0.34% | 0.40% | 0.63% | -0.16% | 0.44% | |
| CHF | 0.76% | -0.23% | -0.10% | -0.05% | 0.20% | -0.63% | -0.44% |
The heat map shows percentage changes of major currencies against each other. The base currency is picked from the left column, while the quote currency is picked from the top row. For example, if you pick the British Pound from the left column and move along the horizontal line to the US Dollar, the percentage change displayed in the box will represent GBP (base)/USD (quote).
Author

Christian Borjon Valencia
FXStreet
Markets analyst, news editor, and trading instructor with over 14 years of experience across FX, commodities, US equity indices, and global macro markets.


