GBP/USD Price Analysis: Pullback remains elusive beyond 1.3465
- GBP/USD seesaws near two-month high, inside bearish chart pattern.
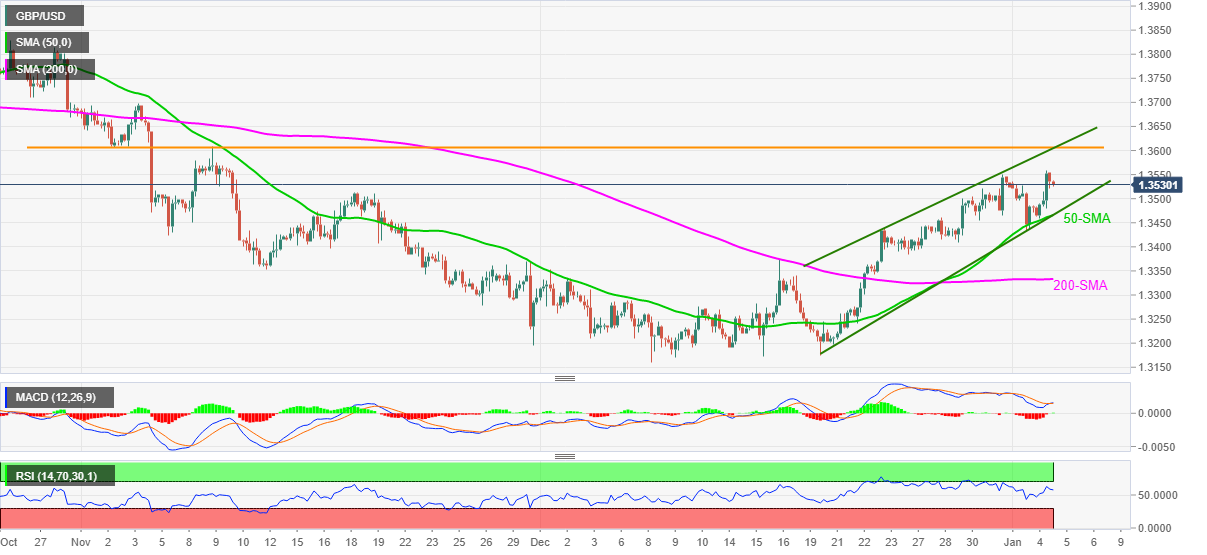
- 50-SMA adds strength to the rising wedge’s support around 1.3465.
- Wedge’s resistance, seven-week-old horizontal line guard short-term upside.
- RSI, MACD join sustained trading beyond the key SMA to favor bulls.
GBP/USD keeps the previous day’s pullback from a two-month high of around 1.3530 during the inactive initial Asian session on Wednesday.
The cable pair refreshed the multi-day top the previous day while justifying MACD rebound and firmer RSI line. However, a 12-day-old rising wedge challenges the buyers.
Even so, the sellers may wait for a confirmation of the bearish chart pattern before taking a fresh entry. The 50-SMA level around 1.3465 increases hardships for the bear’s arrival.
In a case where the quote drops below 1.3465, the 200-SMA level near 1.3330 will offer an intermediate halt during the expected south-run targeting December 2021 low of 1.3160.
On the flip side, GBP/USD buyers can aim for the wedge’s resistance line and multi-day-old horizontal hurdle surrounding 1.3610 during further advances.
Following that, November’s high of 1.3697 and October's peak surrounding 1.3835 will be in focus.
GBP/USD: Four-hour chart
Trend: Further upside expected
Author

Anil Panchal
FXStreet
Anil Panchal has nearly 15 years of experience in tracking financial markets. With a keen interest in macroeconomics, Anil aptly tracks global news/updates and stays well-informed about the global financial moves and their implications.


