|
GBP/USD Price Analysis: Pound pressuring the 1.3140 resistance ahead of Asia
- GBP/USD is breaking up from a triangle pattern.
- The level to beat for bulls is the 1.3140 level.

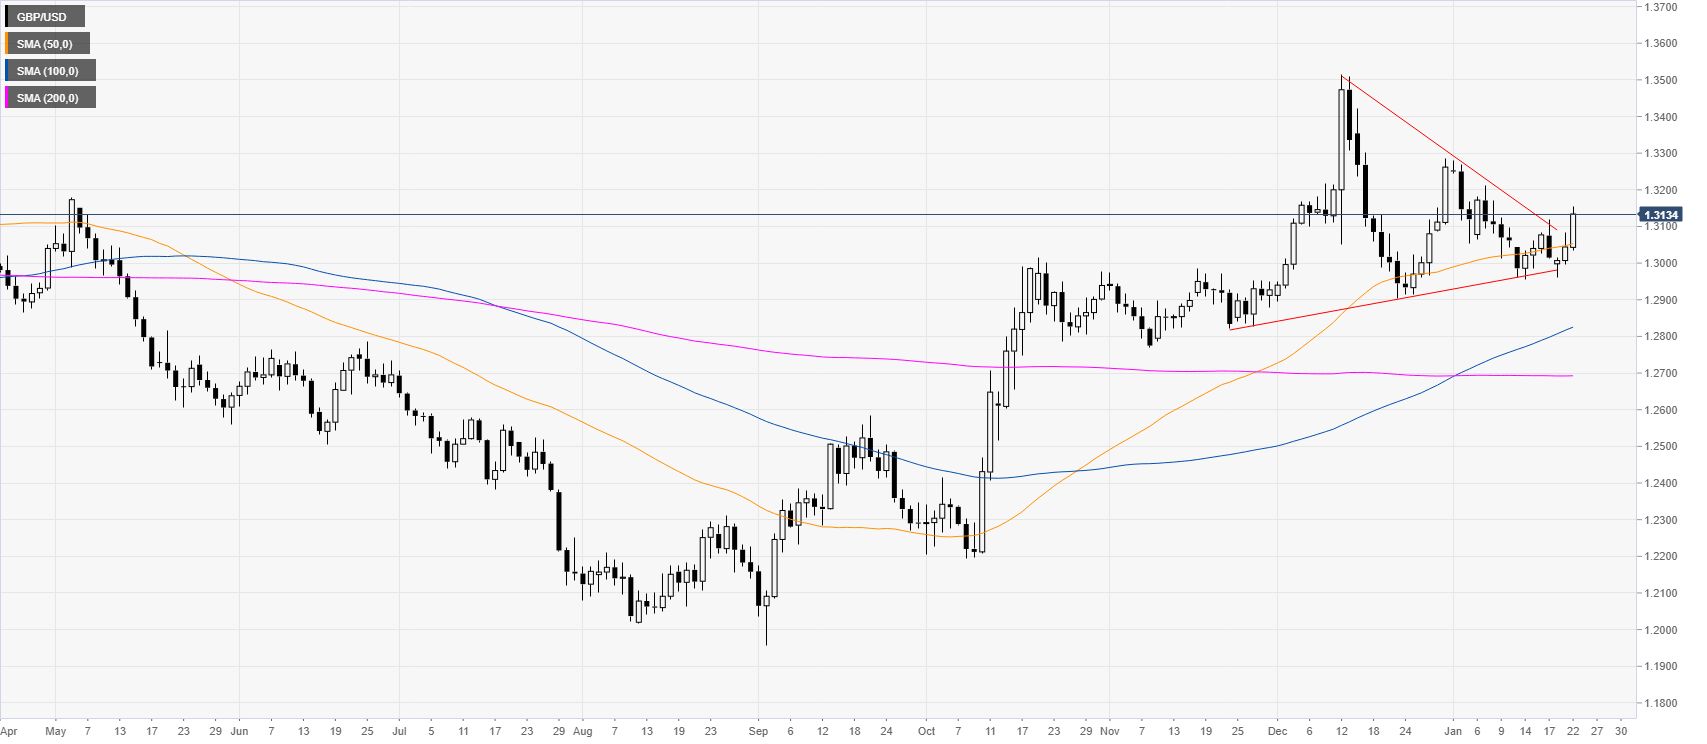
GBP/USD daily chart
GBP/USD is breaking up from a triangle pattern while above its main daily simple moving averages (SMAs). The market at the start of 2020 is holding above the 1.3000 figure.
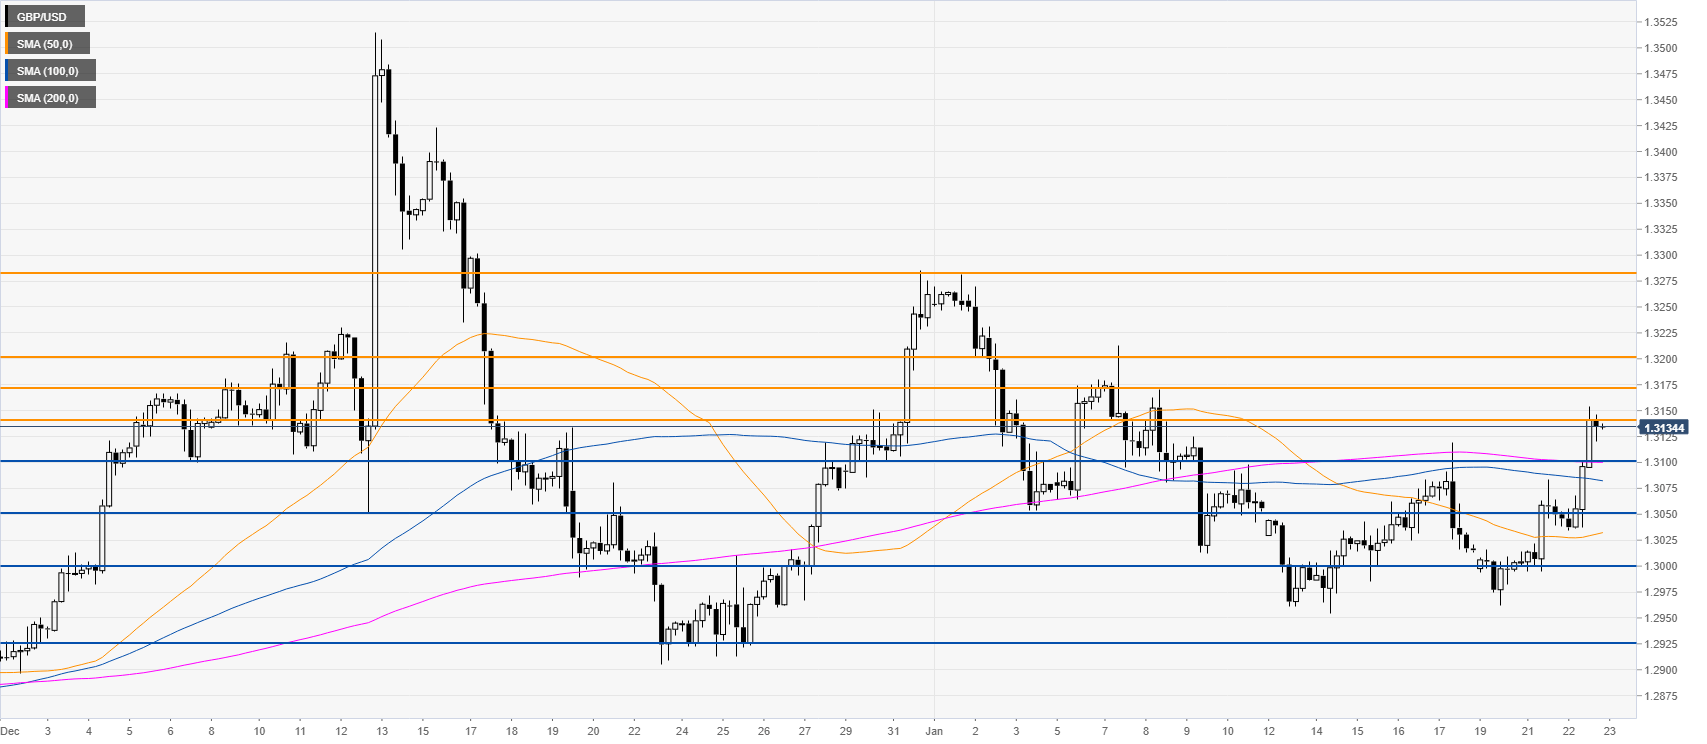
GBP/USD four-hour chart
The pound is challenging the 1.3140 resistance while trading above the main SMAs. As the market is breaking out the bulls want to extend the recent advance towards the 1.3175/1.3200 resistance zone and to 1.3280 resistance. Pullbacks can find support near 1.3100 figure and 1.3050 level, according to the Technical Confluences Indicator.
Additional key levels
Author

Flavio Tosti
Independent Analyst
More from Flavio Tosti


