|

GBP/USD Price Analysis: Pokes weekly resistance line around 1.2100

  • GBP/USD keeps the previous day’s rebound, the consecutive third one from 50% Fibonacci retracement since late July.
  • Steady RSI, impending bull cross on MACD teases buyers to overcome immediate hurdle.
  • 100-SMA adds to the upside filters, multiple supports to challenge bears.

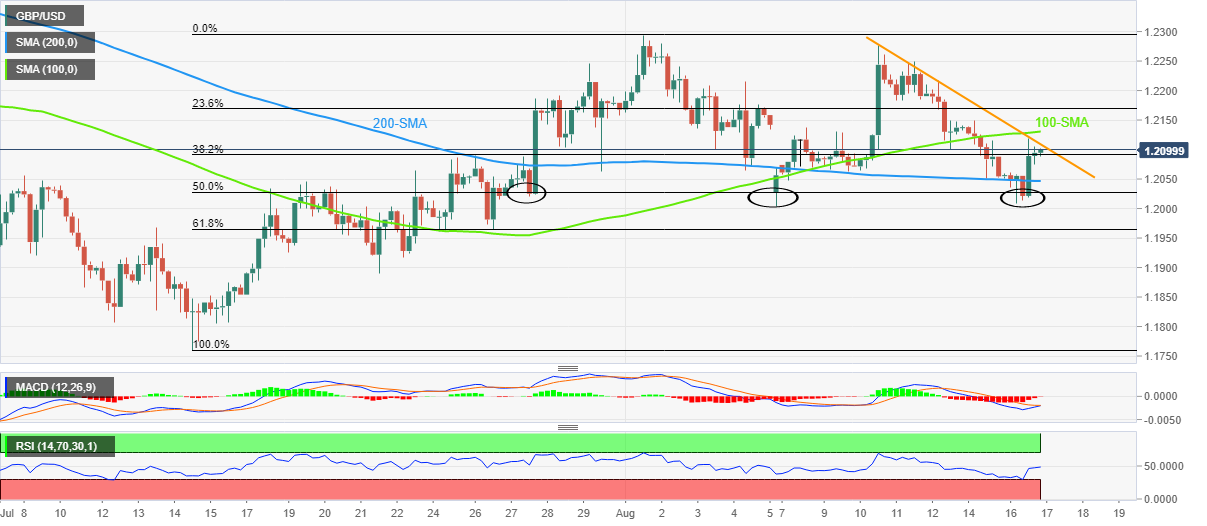
GBP/USD picks up bids to extend the previous day’s recovery to 1.2100 during Wednesday’s Asian session. In doing so, the Cable pair approaches a one-week-old resistance line while also portraying the third bounce off the 50% Fibonacci retracement level of July-August advances.

In addition to the sustained rebound from the key Fibonacci support, steady RSI and a looming bull cross of the MACD also keep the GBP/USD buyers hopeful of overcoming the 1.2110 immediate hurdle.

Even so, the 100-SMA level of 1.2130 acts as an extra filter to the north before giving control to the bulls.

Following that, the 1.2200 threshold may act as an intermediate halt during the run-up to the monthly high near 1.2295.

Alternatively, pullback moves may initially test the 200-SMA, around 1.2045 at the latest, before revisiting the 50% Fibonacci retracement level of 1.2030.

In a case where the GBP/USD bears keep reins past 1.2030 key support, the 61.8% Fibonacci retracement level and late July’s swing low, respectively around 1.1965 and 1.1890, will be in focus.

GBP/USD: Four-hour chart

Trend: Further upside expected

Additional important levels

Overview
Today last price1.2098
Today Daily Change0.0044
Today Daily Change %0.37%
Today daily open1.2054
 
Trends
Daily SMA201.2104
Daily SMA501.2129
Daily SMA1001.2415
Daily SMA2001.2905
 
Levels
Previous Daily High1.2148
Previous Daily Low1.205
Previous Weekly High1.2277
Previous Weekly Low1.2048
Previous Monthly High1.2246
Previous Monthly Low1.176
Daily Fibonacci 38.2%1.2088
Daily Fibonacci 61.8%1.2111
Daily Pivot Point S11.202
Daily Pivot Point S21.1986
Daily Pivot Point S31.1922
Daily Pivot Point R11.2119
Daily Pivot Point R21.2183
Daily Pivot Point R31.2217

Author

Anil Panchal

Anil Panchal

FXStreet

Anil Panchal has nearly 15 years of experience in tracking financial markets. With a keen interest in macroeconomics, Anil aptly tracks global news/updates and stays well-informed about the global financial moves and their implications.

More from Anil Panchal
Share:

Editor's Picks

AUD/USD falls to near 0.7100 after slipping below 50-day EMA

AUD/USD depreciates after registering minor gains in the previous day, trading around 0.7120 during the Asian hours. The technical analysis of the daily chart shows the pair consolidating sideways within a rectangle pattern, as neither bulls nor bears gain control. The AUD/USD pair is holding a slight bearish tone however as it sits beneath both the nine-day and 50-day EMAs.

160.00: USD/JPY back near intervention territory after upbeat US jobs report

US Nonfarm Payrolls beat expectations by a wide margin in May, with 172K jobs added. The US Dollar rebounds after the release, helping USD/JPY recover from its intraday lows. Warnings from Japanese authorities continue to limit upside potential near the 160.00 threshold.

Gold targets $4,300 amid stronger Dollar

Gold faces increasing selling interest and navigates the area of three-month lows near the $4,300 mark per troy ounce on Friday. The precious metal’s decline comes as traders assess the stronger-than-expected NFP, while the bid bias in the Greenback and higher US Treasury yields also collaborate with the retracement.

Cardano hits five-year low even as Hoskinson clarifies "break" isn't an exit

Cardano (ADA) price is down 10% at press time on Friday, extending losses over 30% so far this week amid Charles Hoskinson's clarification that "break" isn't an exit.

Week ahead – Fed countdown begins amid US inflation data and geopolitical risks

Fed Chair Warsh’s first meeting approaches as key US inflation data could reshape expectations. Oil prices remain elevated as US-Iran talks continue; tariffs also return to the spotlight. ECB is expected to hike; will it be a one-off move or is July live?

The US economy defies the rules: 100 days into the Oil shock and the recession signal is still missing

More than three months after the start of the Iran war and the resulting disruption to global energy markets, the US economy continues to display remarkable resilience. The conflict has triggered a sharp rise in Oil prices, reignited inflationary pressures and fueled widespread concerns about a potential economic slowdown.