GBP/USD Price Analysis: Nears three-week-old support trendline
- GBP/USD bears catch a breath near a short-term key support line.
- Close to oversold RSI conditions also favor the pair’s pullback beyond 23.6% Fibonacci retracement.
- December 2019 low will be the key to watch during further downside.

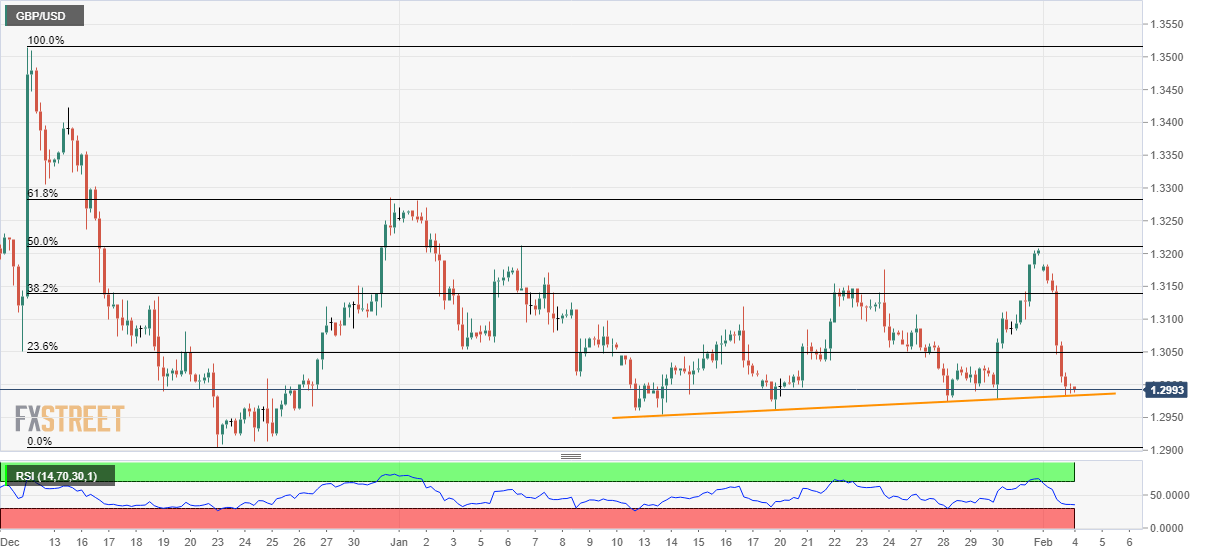
GBP/USD looks for a clear direction near 1.3000 amid the Asian session on Tuesday. The pair registered heaviest losses, -1.6%, during the previous day while staying above the three-week-old support line.
In addition to the immediate trend line support, around 1.2980, close to oversold conditions of RSI also increase the odds of the pair’s pullback.
With this, 23.6% Fibonacci retracement of its declines from December 12 to 23, 2019, at 1.3050, could regain buyers’ attention during the pullback, a break of which recall 1.3100 and January 23 highs near 1.3150.
During the pair’s advances past-1.3150, 50% Fibonacci retracement level close to 1.3210 will be the key to watch.
On the flip side, the pair’s break of the immediate support line, at 1.2980, could please sellers with 1.2950 and December 2019 low of 1.2905.
GBP/USD four-hour chart
Trend: Pullback expected
Author

Anil Panchal
FXStreet
Anil Panchal has nearly 15 years of experience in tracking financial markets. With a keen interest in macroeconomics, Anil aptly tracks global news/updates and stays well-informed about the global financial moves and their implications.


