|

GBP/USD Price Analysis: Mean reversion to 20-EMA looks imminent

  • Sour market sentiment has dragged the Cable below 1.2200.
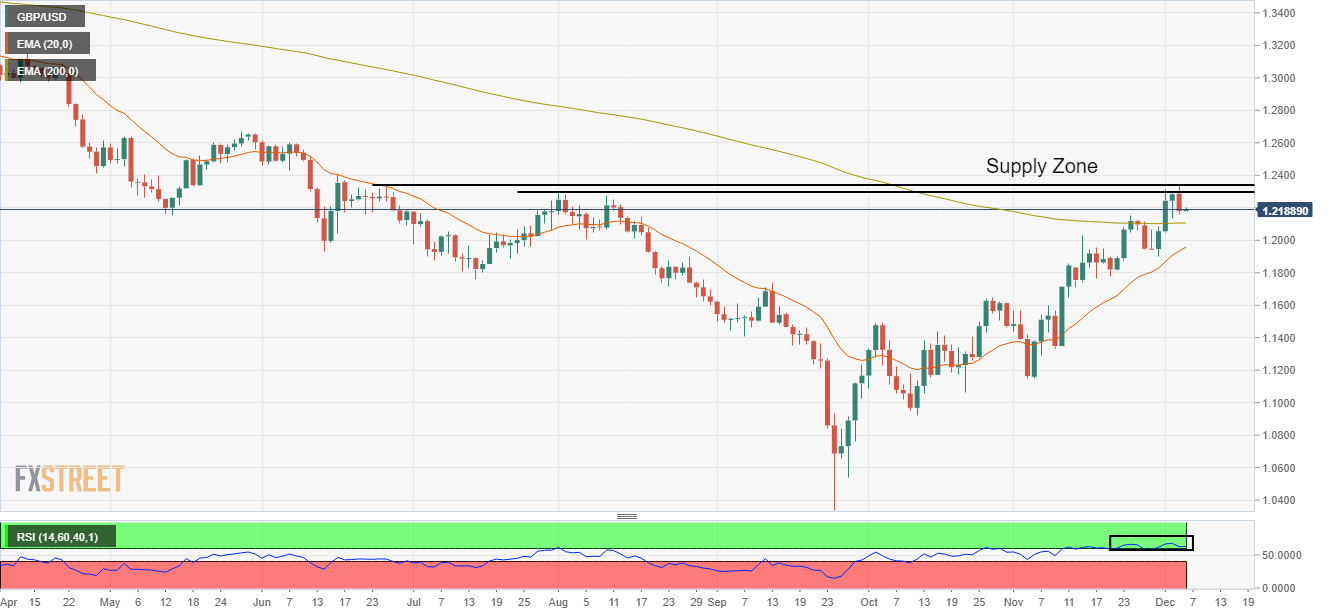
  • An oscillation in the bullish range by the RSI (14) indicates that the bullish momentum is still solid.
  • A mean reversion to the 20-EMA around 1.1970 is highly expected.

The GBP/USD pair has sensed barricades around the immediate hurdle of 1.2200 in the early Tokyo session.  The three-day winning streak of the Cable ended on Monday after it failed to extend its rally above 1.2340. A cautious market mood hammered the Pound Sterling and sent it to lower below the round-level cushion of 1.2200.

Meanwhile, the US Dollar Index (DXY) has witnessed a significant buying interest and has advanced to near 105.40 after refreshing its fresh- foe-month low at 104.10.

On a daily scale, Cable has faced selling pressure after testing the supply zone placed in a narrow range of 1.2292-1.2351. The gap between the Cable and the 20-period Exponential Moving Average (EMA) has escalated, therefore, a mean reversion cannot be ruled out. The Cable is still holding the 200-EMA at 1.2108, which indicates that the long-term trend is still bullish.

Meanwhile, the Relative Strength Index (RSI) (14) is oscillating in a bullish range of 60.00-80.00, which indicates that the bullish momentum is still active.

Going forward, a decline below Friday’s low at 1.2134 will drag the Cable toward the psychological resistance at 1.2000, followed by the 20-EMA around 1.1971.

On the flip side, a break above Monday’s high at 1.2345 will drive the Cable toward June 16 high of around 1.2400. A breach of the latter will send the major toward June 1 low at 1.2460.

GBP/USD daily chart

GBP/USD

Overview
Today last price1.2187
Today Daily Change-0.0096
Today Daily Change %-0.78
Today daily open1.2283
 
Trends
Daily SMA201.1885
Daily SMA501.1503
Daily SMA1001.1656
Daily SMA2001.2149
 
Levels
Previous Daily High1.23
Previous Daily Low1.2134
Previous Weekly High1.2311
Previous Weekly Low1.19
Previous Monthly High1.2154
Previous Monthly Low1.1147
Daily Fibonacci 38.2%1.2237
Daily Fibonacci 61.8%1.2198
Daily Pivot Point S11.2178
Daily Pivot Point S21.2073
Daily Pivot Point S31.2012
Daily Pivot Point R11.2344
Daily Pivot Point R21.2405
Daily Pivot Point R31.251

Author

Sagar Dua

Sagar Dua

FXStreet

Sagar Dua is associated with the financial markets from his college days. Along with pursuing post-graduation in Commerce in 2014, he started his markets training with chart analysis.

More from Sagar Dua
Share:

Editor's Picks

EUR/USD advances as US-Iran peace deal weighs on US Dollar

EUR/USD rises after registering minor losses in the previous day, trading around 1.1610 during the Asian hours on Monday. The pair appreciates as the US Dollar declines amid easing risk aversion following the reports that the United States and Iran agree on a peace deal to end the war and reopen the Strait of Hormuz.


GBP/USD hovers around 1.3400 as investors await war clarity

GBP/USD remains near its daily open, not far from 1.3400, in the second half of Friday's session. The US Dollar lost its previous intraday strength and weakens as investors await clarity on the US-Iran war.

Gold rises to weekly high as US, Iran reach peace deal

Gold price rises to a weekly high during the Asian trading hours on Monday. The precious metal rebounds after the United States and Iran had reached a deal to end their conflict, easing concerns about inflation and higher interest rates.


Experts agree: Bitcoin nears bottom, but weak demand raises doubts

Bitcoin is trading above $63,000 at the time of writing on Friday after rebounding from the key 200-week Simple Moving Average near $62,000, a level widely viewed as key long-term support. The recovery may suggest that Bitcoin has found a floor after a sharp correction that spanned more than a month, but some warning signs persist.

BoJ set to hike, but will it save the Yen?
The Bank of Japan is poised to hike interest rates for the fifth time in this tightening cycle on Tuesday, taking the policy rate from 0.75% to 1.00%. As has become customary for BoJ rate hikes lately, the hawkish rhetoric has been intensifying in the run up to the meeting, with Governor Ueda essentially locking in the move in his last appearance on June 3.
4.2% headline, 0.2% core: Why the Fed's next hike may be targeting the wrong problem

May's CPI put headline inflation at 4.2% on the year, up from 3.8% in April and the hottest reading since April 2023, while core prices rose just 0.2% on the month, undershooting the 0.3% consensus and halving April's pace.