|

GBP/USD Price Analysis: Maintains position above 1.2400 supported by nine-day EMA

  • GBP/USD holds position above the psychological support level at 1.2400
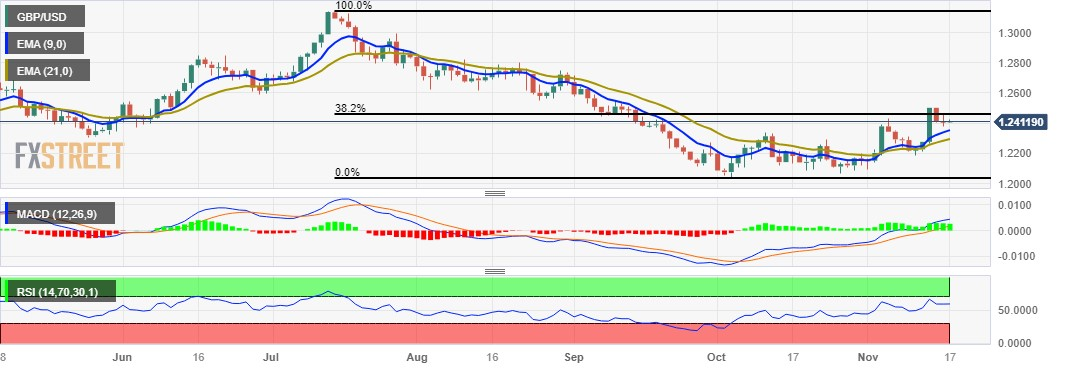
  • A break below the nine-day EMA could further navigate toward a psychological level of 1.2300,
  • The major level of 1.2450 lined up with the 38.2% Fibonacci retracement could act as the key resistance region.

GBP/USD looks to extend its losses for the third consecutive day ahead of the Retail Sales data from the United Kingdom, trading around 1.2410 during the Asian session on Friday. The 1.2400 psychological level serves as immediate support, followed by the next support around 1.2350, which is aligned with the nine-day Exponential Moving Average (EMA) at the 1.2353 level.

A break below the latter could further weigh on the GBP/USD pair, potentially navigating toward the region around the psychological level at 1.2300, in conjunction with the 21-day EMA at 1.2295.

Despite the current downward movement, the technical indicators for the GBP/USD pair present a bullish outlook. The 14-day Relative Strength Index (RSI) above the 50 level indicates upward support, suggesting a robust momentum in favor of the pair.

Additionally, the Moving Average Convergence Divergence (MACD) line, situated above the centerline and showing divergence above the signal line, implies a bullish momentum in the GBP/USD pair.

On the upside, the GBP/USD pair trades below the major level of 1.2450 aligned with the 38.2% Fibonacci retracement at 1.2459, which may serve as the key resistance area. A decisive breakthrough above this barrier has the potential to encourage bullish sentiment, opening the path towards the psychological level at 1.2500, aligning with the weekly high at 1.2505.

GBP/USD: Daily Chart

GBP/USD: More technical levels to watch

Overview
Today last price1.2414
Today Daily Change0.0005
Today Daily Change %0.04
Today daily open1.2409
 
Trends
Daily SMA201.2248
Daily SMA501.2257
Daily SMA1001.2511
Daily SMA2001.2442
 
Levels
Previous Daily High1.2456
Previous Daily Low1.2376
Previous Weekly High1.2429
Previous Weekly Low1.2187
Previous Monthly High1.2337
Previous Monthly Low1.2037
Daily Fibonacci 38.2%1.2407
Daily Fibonacci 61.8%1.2426
Daily Pivot Point S11.2372
Daily Pivot Point S21.2334
Daily Pivot Point S31.2292
Daily Pivot Point R11.2451
Daily Pivot Point R21.2493
Daily Pivot Point R31.2531

Author

Akhtar Faruqui

Akhtar Faruqui is a Forex Analyst based in New Delhi, India. With a keen eye for market trends and a passion for dissecting complex financial dynamics, he is dedicated to delivering accurate and insightful Forex news and analysis.

More from Akhtar Faruqui
Share:

Markets move fast. We move first.

Orange Juice Newsletter brings you expert driven insights - not headlines. Every day on your inbox.

By subscribing you agree to our Terms and conditions.

Editor's Picks

EUR/USD rebounds after falling toward 1.1700

EUR/USD gains traction and trades above 1.1730 in the American session, looking to end the week virtually unchanged. The bullish opening in Wall Street makes it difficult for the US Dollar to preserve its recovery momentum and helps the pair rebound heading into the weekend.

GBP/USD steadies below 1.3400 as traders assess BoE policy outlook

Following Thursday's volatile session, GBP/USD moves sideways below 1.3400 on Friday. Investors reassess the Bank of England's policy oıtlook after the MPC decided to cut the interest rate by 25 bps by a slim margin. Meanwhile, the improving risk mood helps the pair hold its ground.

Gold stays below $4,350, looks to post small weekly gains

Gold struggles to gather recovery momentum and stays below $4,350 in the second half of the day on Friday, as the benchmark 10-year US Treasury bond yield edges higher. Nevertheless, the precious metal remains on track to end the week with modest gains as markets gear up for the holiday season.

Crypto Today: Bitcoin, Ethereum, XRP rebound amid bearish market conditions

Bitcoin (BTC) is edging higher, trading above $88,000 at the time of writing on Monday. Altcoins, including Ethereum (ETH) and Ripple (XRP), are following in BTC’s footsteps, experiencing relief rebounds following a volatile week.

How much can one month of soft inflation change the Fed’s mind?

One month of softer inflation data is rarely enough to shift Federal Reserve policy on its own, but in a market highly sensitive to every data point, even a single reading can reshape expectations. November’s inflation report offered a welcome sign of cooling price pressures. 

XRP rebounds amid ETF inflows and declining retail demand demand

XRP rebounds as bulls target a short-term breakout above $2.00 on Friday. XRP ETFs record the highest inflow since December 8, signaling growing institutional appetite.