|

GBP/USD Price Analysis: Intraday positive move falters near 200-DMA/50% Fibo. confluence

  • GBP/USD struggled to capitalize on its intraday move and faced rejection near the 1.3800 mark.
  • Mixed technical indicators on hourly/daily charts warrant some caution for aggressive traders.
  • Bulls would wait for a sustained move beyond the 200-day SMA and 50% Fibo. confluence hurdle.

The GBP/USD pair retreated around 30-35 pips from two-week tops and was last seen trading with only modest intraday gains, around the 1.3765-70 region.

A combination of factors continued weighing on the US dollar and assisted the GBP/USD pair to regain positive traction on Tuesday. However, the recent spike in new COVID-19 cases in the UK acted as a headwind for the British pound and capped gains for the major.

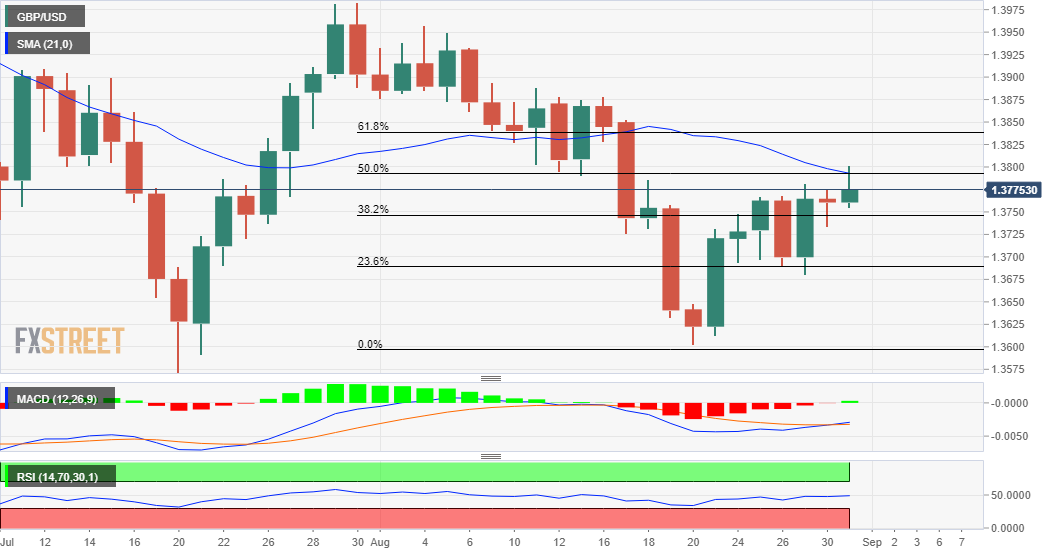
Looking at the technical picture, the positive move stalled near the 1.3800 confluence hurdle. This comprises the very important 200-day SMA and the 50% Fibonacci level of the 1.3984-1.3602 downfall, which should now act as a pivotal point for short-term traders.

Meanwhile, technical indicators on hourly charts are holding comfortably in the positive territory but are yet to confirm a bullish bias on the daily chart. This makes it prudent to wait for a sustained move beyond the mentioned barrier before placing fresh bullish bets.

From current levels, the 38.2% Fibo. level, around the 1.3745 region is likely to protect the immediate downside. A convincing break below might prompt some technical selling and drag the GBP/USD pair back towards testing sub-1.3700 levels, or the 23.6% Fibo. support.

On the flip side, the 1.3800 mark might continue to act as a strong barrier, which if cleared decisively will set the stage for additional gains. The GBP/USD pair might then climb to the 61.8% Fibo. level, around the 1.3840 region, before aiming to reclaim the 1.3900 mark.

GBP/USD daily chart

fxsoriginal

Technical levels to watch

GBP/USD

Overview
Today last price1.3773
Today Daily Change0.0013
Today Daily Change %0.09
Today daily open1.376
 
Trends
Daily SMA201.3794
Daily SMA501.3818
Daily SMA1001.3922
Daily SMA2001.3806
 
Levels
Previous Daily High1.3775
Previous Daily Low1.3734
Previous Weekly High1.3781
Previous Weekly Low1.3612
Previous Monthly High1.3984
Previous Monthly Low1.3572
Daily Fibonacci 38.2%1.375
Daily Fibonacci 61.8%1.3759
Daily Pivot Point S11.3738
Daily Pivot Point S21.3715
Daily Pivot Point S31.3696
Daily Pivot Point R11.3779
Daily Pivot Point R21.3798
Daily Pivot Point R31.3821

Author

Haresh Menghani

Haresh Menghani is a detail-oriented professional with 10+ years of extensive experience in analysing the global financial markets.

More from Haresh Menghani
Share:

Markets move fast. We move first.

Orange Juice Newsletter brings you expert driven insights - not headlines. Every day on your inbox.

By subscribing you agree to our Terms and conditions.

Editor's Picks

EUR/USD holds steady near 1.1750 on first trading day of 2026

EUR/USD stays calm on Friday and trades in a narrow channel at around 1.1750 as trading conditions remain thin following the New Year holiday and ahead of the weekend. The economic calendar will not feature any high-impact data releases.

GBP/USD struggles to gain traction, stabilizes above 1.3450

After testing 1.3400 on the last day of 2025, GBP/USD managed to stage a rebound. Nevertheless, the pair finds it difficult to gather momentum and moves sideways above 1.3450 as market participants remain in holiday mood.

Gold climbs toward $4,400 following deep correction

Gold reverses its direction and advances toward $4,400 after suffering heavy losses amid profit-taking before the New Year holiday. Growing expectations for a dovish Fed policy and persistent geopolitical risks seem to be helping XAU/USD stretch higher.

Cardano gains early New Year momentum, bulls target falling wedge breakout

Cardano kicks off the New Year on a positive note and is extending gains, trading above $0.36 at the time of writing on Friday. Improving on-chain and derivatives data point to growing bullish interest, while the technical outlook keeps an upside breakout in focus.

Economic outlook 2026-2027 in advanced countries: Solidity test

After a year marked by global economic resilience and ending on a note of optimism, 2026 looks promising and could be a year of solid economic performance. In our baseline scenario, we expect most of the supportive factors at work in 2025 to continue to play a role in 2026.

Crypto market outlook for 2026

Year 2025 was volatile, as crypto often is.  Among positive catalysts were favourable regulatory changes in the U.S., rise of Digital Asset Treasuries (DAT), adoption of AI and tokenization of Real-World-Assets (RWA).