GBP/USD Price Analysis: Holds steady above mid-1.2600s, not out of the woods yet
- GBP/USD struggles to register any meaningful recovery and hangs near a one-month trough.
- Bets for an early rate cut by the BoE undermine the GBP and act as a headwind for the major.
- September Fed rate cut bets cap the upside for the USD and help limit losses for spot prices.
- A break below 100-day SMA is needed to support prospects for a further depreciating move.

The GBP/USD pair is seen oscillating in a range during the Asian session on Friday and consolidating the previous day's post-Bank of England (BoE) decline to over a one-month low. Spot prices currently trade just above mid-1.2600s and seem vulnerable to prolonging the recent retracement slide from a multi-month peak, around the 1.2860 region touched last week.
The markets started pricing in a greater chance of a rate cut in August after the BoE Governor Andrew Bailey said on Thursday that it was "good news" that official figures had shown inflation was back at its 2% target. This might continue to undermine the British Pound (GBP) ahead of the UK election on July 4 and validate the negative outlook for the GBP/USD pair. The US Dollar (USD), on the other hand, struggles to capitalize on the previous day's strong move up amid expectations for an imminent start of the Federal Reserve's (Fed) rate-cutting cycle in September. This, in turn, is seen lending some support to the currency pair.
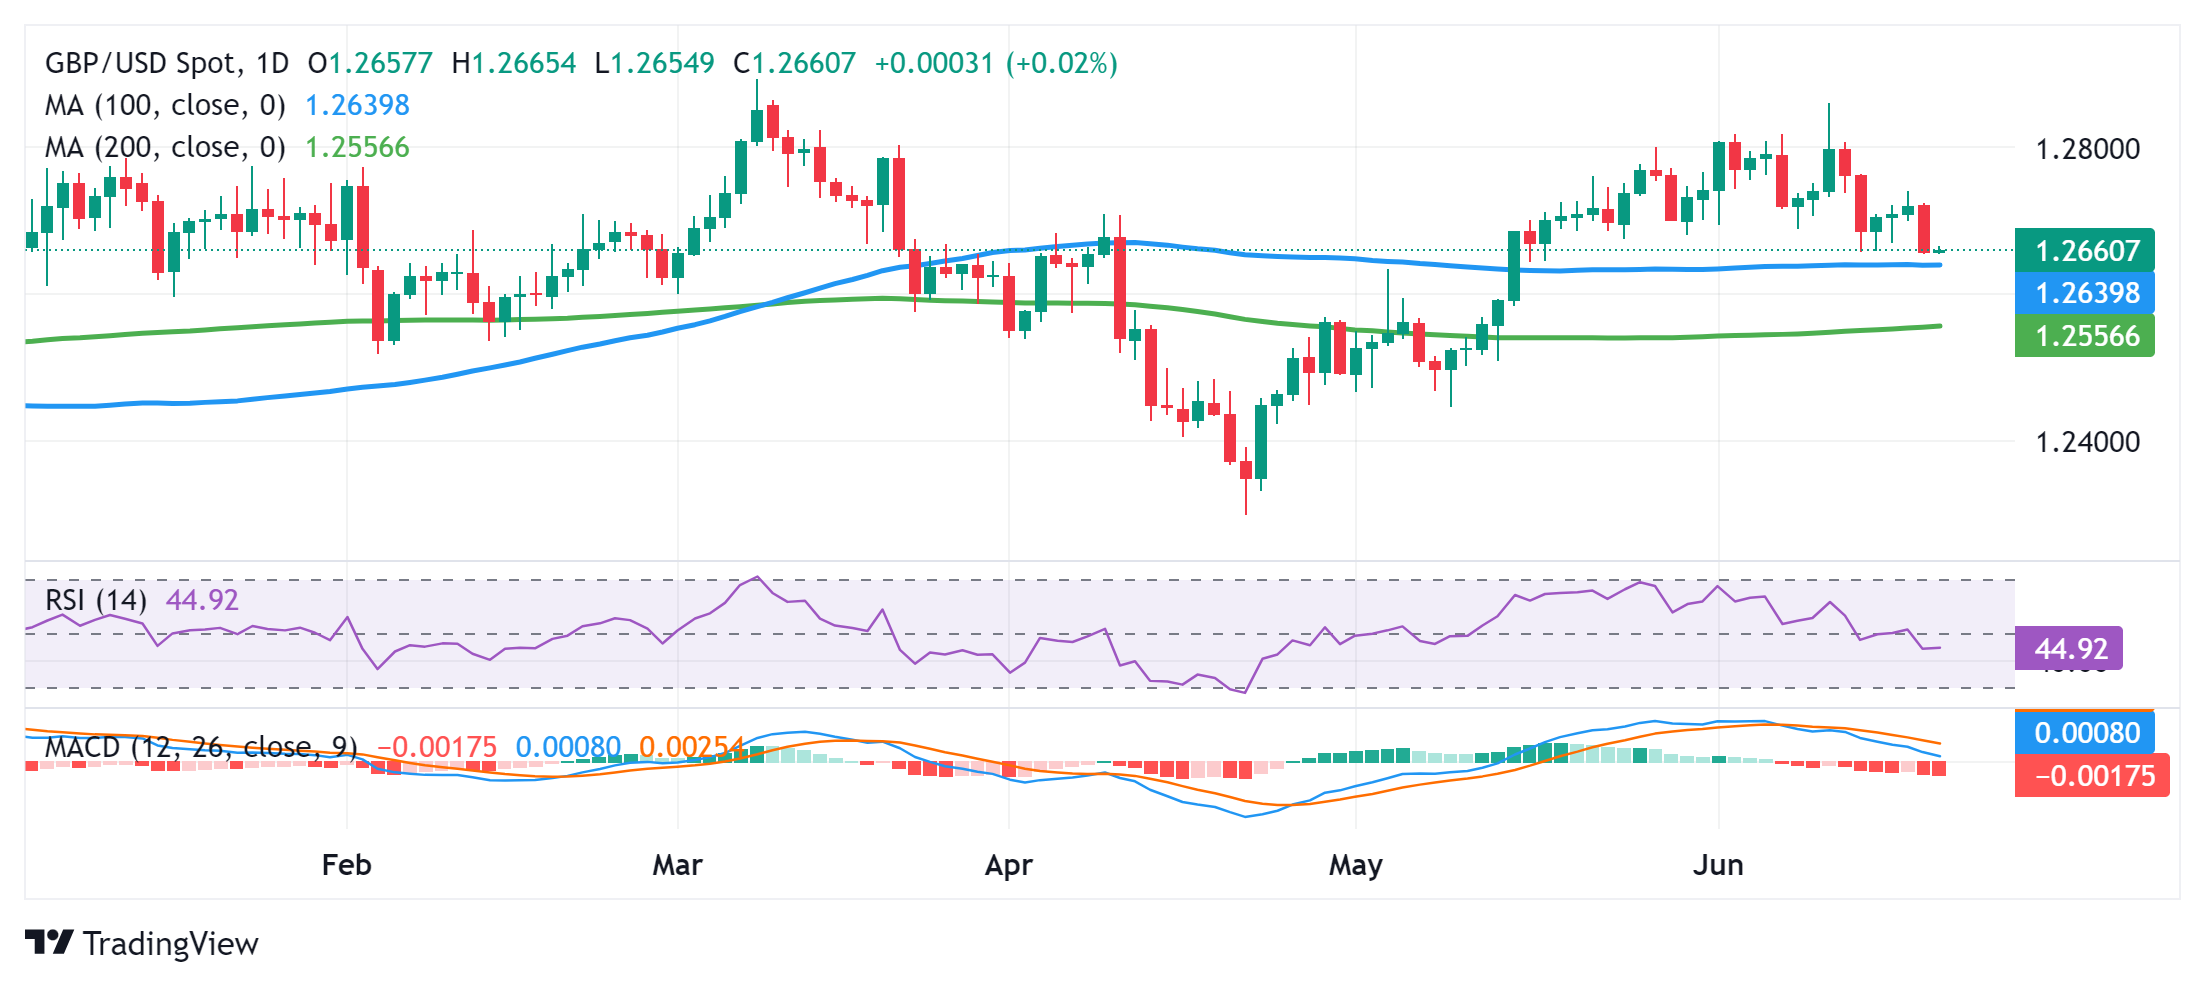
From a technical perspective, bearish traders need to wait for some follow-through selling below the 100-day Simple Moving Average (SMA) support, currently pegged near the 1.2640-1.2635 region, before placing fresh bets. Given that oscillators on the daily chart have just started gaining negative traction, the GBP/USD pair might then accelerate the fall towards the 1.2600 mark. The downward trajectory could extend further towards challenging the very important 200-day SMA, around the 1.2560-1.2555 region en route to the 1.2500 psychological mark and the May monthly swing low, around the 1.2445 area.
On the flip side, any attempted recovery might now confront immediate resistance near the 1.2685 region ahead of the 1.2700 mark and the 1.2715-1.2720 supply zone. This is closely followed by the weekly top, around the 1.2740 area, which if cleared could trigger a short-covering rally and lift the GBP/USD pair to the 1.2800 round figure. The subsequent strength should pave the way for a move towards retesting the monthly swing high, around the 1.2860 zone, en route to the YTD peak, around the 1.2900 neighborhood touched in March.
GBP/USD daily chart
Author

Haresh Menghani
FXStreet
Haresh Menghani is a detail-oriented professional with 10+ years of extensive experience in analysing the global financial markets.


