|

GBP/USD Price Analysis: Holds positive ground below the mid-1.2500s, further upside looks favorable

  • GBP/USD gains traction near 1.2540 ahead of the US PMI data.
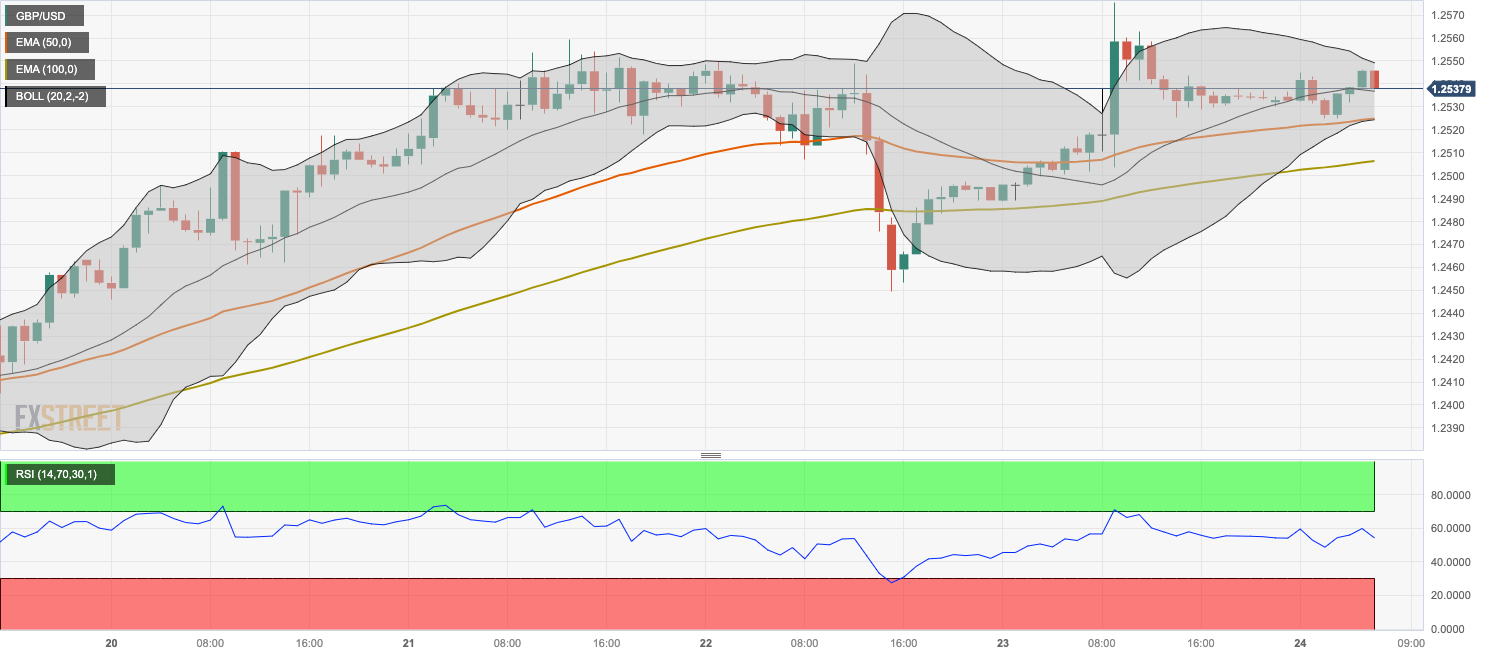
  • The pair holds above the 50- and 100-hour EMA; the RSI indicator stands in bullish territory above 50.
  • 1.2550 will be the first resistance level; the critical support level will emerge at 1.2525.

The GBP/USD pair gains ground to a two-month high of 1.2575 and then pulled back to 1.2540 during the Asian trading hours on Friday. The uptick of the pair is supported by the stronger-than-expected UK S&P Global/CIPS PMI data for November. The attention will shift to the US S&P Global PMI data, due later on Friday.

On Thursday, the preliminary UK S&P Global/CIPS Composite PMI grew unexpectedly in November, coming in at 50.1 in November from 48.7 in October, better than expected of 48.7. Additionally, the Manufacturing PMI improved to 46.7 versus 44.8 prior, while the Services PMI rose to 50.5 from 49.5 previously. The British Pound (GBP) surged against the US Dollar (USD) as the Bank of England (BoE) Governor Andrew Bailey suggested interest rates could remain higher for longer than priced by investors.

According to the four-hour chart, GBP/USD holds above the 50- and 100-hour Exponential Moving Averages (EMAs), suggesting the path of least resistance is to the upside. The upper boundary of the Bollinger Band at 1.2550 will be the first resistance level for the pair. The next hurdle is seen near a high of November 23 at 1.2575. Further north, the upside target to watch is a high of September 4 at 1.2642, followed by a high of September 1 at 1.2713.

On the downside, the critical support level will emerge at 1.2525, portraying the confluence of the lower limit of the Bollinger Band and the 50-hour EMA. A break below the latter will pave the way to the 100-hour EMA and a psychological round mark at the 1.2500–1.2505 region. Any follow-through selling will see a drop to a high of November 16 at 1.2456 and finally at 1.2400 (round figure).

It’s worth noting that the Relative Strength Index (RSI) holds in the bullish territory above 50, indicating further upside looks favorable.

(This story was corrected on November 24 at 08:13 GMT to say, in the first paragraph, that the GBP/USD pair gained ground to a two-month high of 1.2575, not 1.2569.)

GBP/USD four-hour chart

GBP/USD

Overview
Today last price1.2538
Today Daily Change0.0004
Today Daily Change %0.03
Today daily open1.2534
 
Trends
Daily SMA201.2334
Daily SMA501.226
Daily SMA1001.2501
Daily SMA2001.2453
 
Levels
Previous Daily High1.2576
Previous Daily Low1.2489
Previous Weekly High1.2506
Previous Weekly Low1.2213
Previous Monthly High1.2337
Previous Monthly Low1.2037
Daily Fibonacci 38.2%1.2543
Daily Fibonacci 61.8%1.2522
Daily Pivot Point S11.249
Daily Pivot Point S21.2446
Daily Pivot Point S31.2403
Daily Pivot Point R11.2577
Daily Pivot Point R21.262
Daily Pivot Point R31.2664

Author

Lallalit Srijandorn

Lallalit Srijandorn is a Parisian at heart. She has lived in France since 2019 and now becomes a digital entrepreneur based in Paris and Bangkok.

More from Lallalit Srijandorn
Share:

Markets move fast. We move first.

Orange Juice Newsletter brings you expert driven insights - not headlines. Every day on your inbox.

By subscribing you agree to our Terms and conditions.

Editor's Picks

EUR/USD climbs toward 1.1800 on broad USD weakness

EUR/USD gathers bullish momentum and advances toward 1.1800 in the second half of the day on Tuesday. The US Dollar weakens and helps the pair stretch higher after the employment report showed that Nonfarm Payrolls declined by 105,000 in October before rising by 64,000 in November.

GBP/USD climbs to fresh two-month high above 1.3400

GBP/USD gains traction in the American session and trades at its highest level since mid-October above 1.3430. The British Pound benefits from upbeat PMI data, while the US Dollar struggles to find demand following the mixed employment figures and weaker-than-forecast PMI prints, allowing the pair to march north.

Gold recovers above $4,300 as markets react to weak US data

Gold trades in positive above $4,300 after spending the first half of the day under bearish pressure. XAU/USD capitalizes on renewed USD weakness after the jobs report showed that the Unemployment Rate climbed to 4.6% in November and the PMI data revealed a loss of growth momentum in the private sector in December. 

US Retail Sales virtually unchanged at $732.6 billion in October

Retail Sales in the United States were virtually unchanged at $732.6 billion in October, the US Census Bureau reported on Tuesday. This print followed the 0.1% increase (revised from 0.3%) recorded in September and came in below the market expectation of +0.1%.

Ukraine-Russia in the spotlight once again

Since the start of the week, gold’s price has moved lower, but has yet to erase the gains made last week. In today’s report we intend to focus on the newest round of peace talks between Russia and Ukraine, whilst noting the release of the US Employment data later on day and end our report with an update in regards to the tensions brewing in Venezuela.

BNB Price Forecast: BNB slips below $855 as bearish on-chain signals and momentum indicators turn negative

BNB, formerly known as Binance Coin, continues to trade down around $855 at the time of writing on Tuesday, after a slight decline the previous day. Bearish sentiment further strengthens as BNB’s on-chain and derivatives data show rising retail activity.