GBP/USD Price Analysis: Grinds below 1.2600 within fortnight-old bullish channel


  • GBP/USD pares the biggest daily jump in three months at monthly peak.
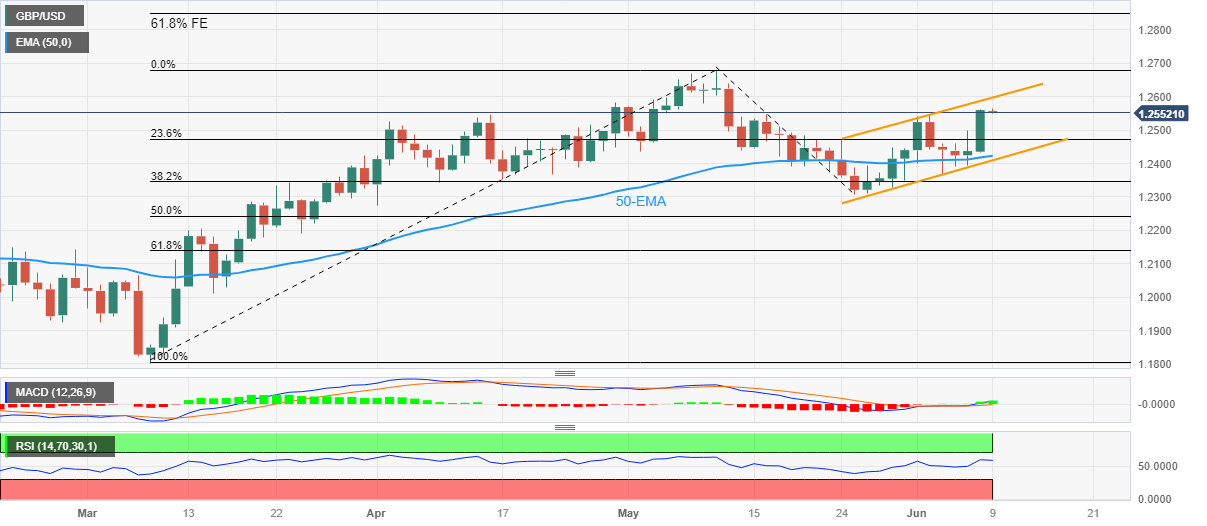
  • 12-day-old bullish channel, upbeat oscillators keep buyers hopeful.
  • RSI conditions suggest retreat in Cable prices before the next run-up.

GBP/USD buyers take a breather at the highest level in one month, making rounds to 1.2550 during early Friday morning in Europe. In doing so, the Cable bulls pause after posting the biggest daily gain since early March the previous day.

While the above 50.0 levels of the RSI (14) line could be held responsible for the Pound Sterling’s latest retreat, the bullish MACD signals and a two-week-long rising trend channel keeps the buyers hopeful.

Hence, the quote’s latest pullback remains elusive unless it stays within the aforementioned channel, currently between 1.2600 and 1.2410.

That said, a short-term correction toward the 50-bar Exponential Moving Average (EMA) level of around 1.2420 can’t be ruled out.

In a case where the Cable pair breaks the 1.2410 support, the odds of witnessing a quick fall toward the previous monthly low of around 1.2310-05 can’t be ruled out.

Meanwhile, an upside break of the stated channel’s peak of 1.2600 may have a reason to worry unless the GBP/USD remains below the yearly high marked in May at around 1.2680.

Following that, the 61.8% Fibonacci Expansion (FE) of the Cable pair’s March-May moves, near 1.2850, will be in the spotlight.

Overall, GBP/USD remains on the bull’s radar but a pullback can’t be ruled out.

GBP/USD: Daily chart

Trend: Gradual upside expected

Additional important levels

Overview
Today last price 1.2554
Today Daily Change -0.0006
Today Daily Change % -0.05%
Today daily open 1.256
 
Trends
Daily SMA20 1.2437
Daily SMA50 1.2464
Daily SMA100 1.2307
Daily SMA200 1.2011
 
Levels
Previous Daily High 1.2561
Previous Daily Low 1.2433
Previous Weekly High 1.2545
Previous Weekly Low 1.2327
Previous Monthly High 1.268
Previous Monthly Low 1.2308
Daily Fibonacci 38.2% 1.2512
Daily Fibonacci 61.8% 1.2482
Daily Pivot Point S1 1.2475
Daily Pivot Point S2 1.239
Daily Pivot Point S3 1.2347
Daily Pivot Point R1 1.2603
Daily Pivot Point R2 1.2646
Daily Pivot Point R3 1.2731


Share: Feed news

Information on these pages contains forward-looking statements that involve risks and uncertainties. Markets and instruments profiled on this page are for informational purposes only and should not in any way come across as a recommendation to buy or sell in these assets. You should do your own thorough research before making any investment decisions. FXStreet does not in any way guarantee that this information is free from mistakes, errors, or material misstatements. It also does not guarantee that this information is of a timely nature. Investing in Open Markets involves a great deal of risk, including the loss of all or a portion of your investment, as well as emotional distress. All risks, losses and costs associated with investing, including total loss of principal, are your responsibility. The views and opinions expressed in this article are those of the authors and do not necessarily reflect the official policy or position of FXStreet nor its advertisers. The author will not be held responsible for information that is found at the end of links posted on this page.

If not otherwise explicitly mentioned in the body of the article, at the time of writing, the author has no position in any stock mentioned in this article and no business relationship with any company mentioned. The author has not received compensation for writing this article, other than from FXStreet.

FXStreet and the author do not provide personalized recommendations. The author makes no representations as to the accuracy, completeness, or suitability of this information. FXStreet and the author will not be liable for any errors, omissions or any losses, injuries or damages arising from this information and its display or use. Errors and omissions excepted.

The author and FXStreet are not registered investment advisors and nothing in this article is intended to be investment advice.

Recommended content


Recommended content

Editors’ Picks

EUR/USD clings to daily gains above 1.0650

EUR/USD clings to daily gains above 1.0650

EUR/USD gained traction and turned positive on the day above 1.0650. The improvement seen in risk mood following the earlier flight to safety weighs on the US Dollar ahead of the weekend and helps the pair push higher.

EUR/USD News

GBP/USD recovers toward 1.2450 after UK Retail Sales data

GBP/USD recovers toward 1.2450 after UK Retail Sales data

GBP/USD reversed its direction and advanced to the 1.2450 area after touching a fresh multi-month low below 1.2400 in the Asian session. The positive shift seen in risk mood on easing fears over a deepening Iran-Israel conflict supports the pair.

GBP/USD News

Gold holds steady at around $2,380 following earlier spike

Gold holds steady at around $2,380 following earlier spike

Gold stabilized near $2,380 after spiking above $2,400 with the immediate reaction to reports of Israel striking Iran. Meanwhile, the pullback seen in the US Treasury bond yields helps XAU/USD hold its ground.

Gold News

Bitcoin Weekly Forecast: BTC post-halving rally could be partially priced in Premium

Bitcoin Weekly Forecast: BTC post-halving rally could be partially priced in

Bitcoin price shows no signs of directional bias while it holds above  $60,000. The fourth BTC halving is partially priced in, according to Deutsche Bank’s research. 

Read more

Geopolitics once again take centre stage, as UK Retail Sales wither

Geopolitics once again take centre stage, as UK Retail Sales wither

Nearly a week to the day when Iran sent drones and missiles into Israel, Israel has retaliated and sent a missile into Iran. The initial reports caused a large uptick in the oil price.

Read more

Forex MAJORS

Cryptocurrencies

Signatures