|

GBP/USD Price Analysis: Downside looks favored as US PCE data supports more rates from Fed

  • GBP/USD is looking vulnerable above 1.1940 amid the risk-off market mood.
  • The USD Index is gathering strength to reclaim the immediate resistance of 105.00 amid hawkish Fed bets.
  • Downward-sloping 20-and 50-period EMAs add to the downside filters.

The GBP/USD pair is displaying a volatility contraction around 1.1940 in the early Tokyo session. The Cable looks set to deliver further weakness as a fresh renewal in the Federal Reserve’s (Fed) hawkish bets has strengthened the US Dollar.

S&P500 futures witnessed immense pressure last week on hopes that more rates are in pipeline by the Fed as the United States inflation has turned persistent due to the strong labor market. The US Dollar Index (DXY) is gathering strength to reclaim the immediate resistance of 105.00. A jump in the monthly US core Personal Consumption Expenditure (PCE) price index by 0.6% sent 10-year US Treasury yields to near 3.95%.

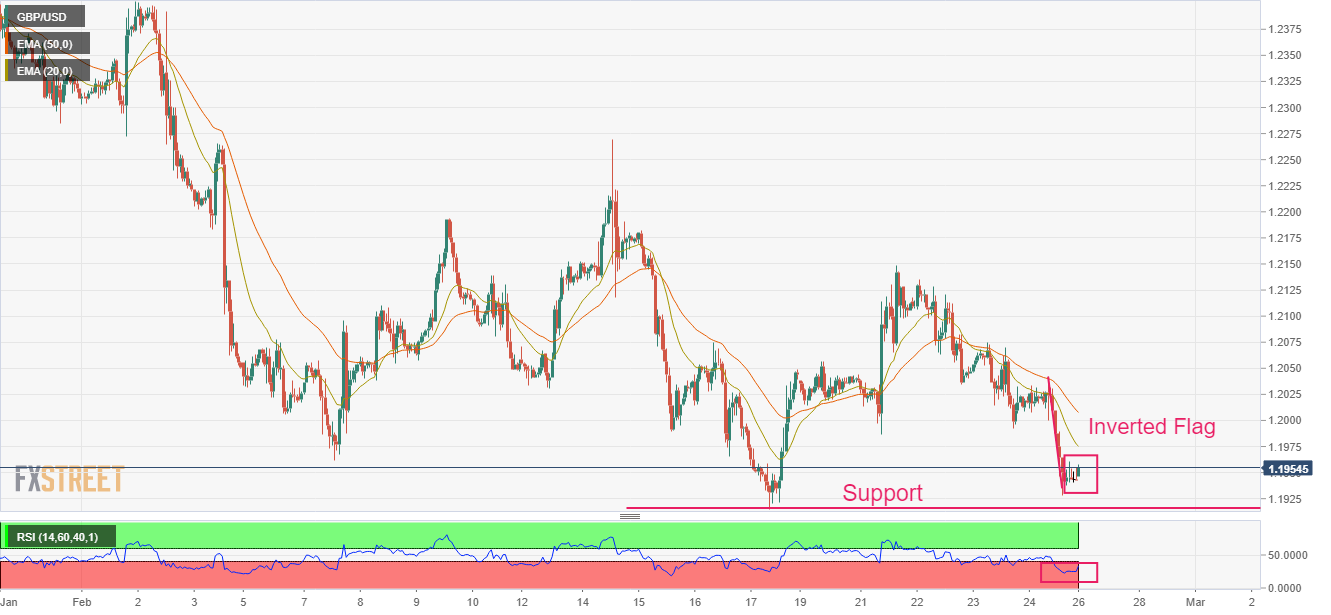
GBP/USD is auctioning in an Inverted Flag chart pattern on an hourly scale. The chart pattern indicates a sheer consolidation that is followed by a breakdown. Usually, the consolidation phase of the chart pattern serves as an inventory adjustment in which those participants initiate shorts, which prefer to enter an auction after the establishment of a bearish bias.

It is worth noting that the Inverted Flag is forming around the horizontal support plotted from February 17 low at 1.1915. An inventory adjustment near crucial support indicates that bulls US Dollar bulls are gathering strength to discover more losses.

Downward-sloping 20-and 50-period Exponential Moving Averages (EMAs) at 1.2007 and 1.975 respectively, add to the downside filters.

The Relative Strength Index (RSI) (14) is oscillating in the 20.00-40.00 range, which indicates that the downside momentum is active.

A confident break below February 17 low at 1.1915 will drag the Cable firmly towards January 5 low at 1.1875 followed by the round-level support at 1.1800.

On the contrary, a move above February 24 high at 1.2040 will drive the asset towards February 23 high around 1.2080. A breach of the latter will expose the asset to February 21 high of around 1.2140.

GBP/USD hourly chart

GBP/USD

Overview
Today last price1.1949
Today Daily Change0.0006
Today Daily Change %0.05
Today daily open1.1943
 
Trends
Daily SMA201.2109
Daily SMA501.2149
Daily SMA1001.1941
Daily SMA2001.193
 
Levels
Previous Daily High1.2042
Previous Daily Low1.1928
Previous Weekly High1.2148
Previous Weekly Low1.1928
Previous Monthly High1.2448
Previous Monthly Low1.1841
Daily Fibonacci 38.2%1.1972
Daily Fibonacci 61.8%1.1999
Daily Pivot Point S11.19
Daily Pivot Point S21.1858
Daily Pivot Point S31.1787
Daily Pivot Point R11.2014
Daily Pivot Point R21.2085
Daily Pivot Point R31.2127

Author

Sagar Dua

Sagar Dua

FXStreet

Sagar Dua is associated with the financial markets from his college days. Along with pursuing post-graduation in Commerce in 2014, he started his markets training with chart analysis.

More from Sagar Dua
Share:

Editor's Picks

EUR/USD climbs to daily highs near 1.1820

EUR/USD now picks up pace and advances to the area of daily peaks north of the 1.1800 barrier at the end of the week. The pair’s decent move higher comes against the backdrop of a generalised lack of direction in the FX galaxy and the mild offered stance in the US Dollar.

GBP/USD trims losses, retests 1.3460

After briefly challenging its key 200-day SMA near 1.3440, GBP/USD now manages to regain some balance and revisit the 1.3460 zone on Friday. Cable’s pullback comes as the selling pressure on the Greenback gathers traction, reigniting some recovery in the risk-linked space.

Gold flirts with four-week highs past $5,200

Gold extends its rebound, climbing for a third consecutive session and pushing back above the $5,200 mark per troy ounce on Friday. The move higher continues to draw support from lingering geopolitical tensions and the ongoing uncertainty surrounding US trade policy, both of which are keeping safe-haven demand firmly in play.

Bitcoin, Ethereum and Ripple consolidate with short-term cautious bullish bias

Bitcoin, Ethereum and Ripple are consolidating near key technical areas on Friday, showing mild signs of stabilization after recent volatility. BTC holds above $67,000 despite mild losses so far this week, while ETH hovers around $2,000 after a rejection near its upper consolidation boundary. 

Changing the game: International implications of recent tariff developments

The Supreme Court ruling on International Emergency Economic Powers Act (IEEPA) tariffs provides limited relief for the rest of the world, with weighted average tariff rates modestly lower.

Starknet unveils strkBTC, shielded Bitcoin transactions on Ethereum Layer 2

Starknet, the Ethereum Layer 2 network developed by StarkWare, today announced strkBTC, a wrapped Bitcoin asset that introduces optional shielding while preserving full DeFi composability.