|

GBP/USD Price Analysis: Consolidates around 1.2750 followed by a barrier at 21-day EMA

  • GBP/USD hovers around a major level at 1.2750.
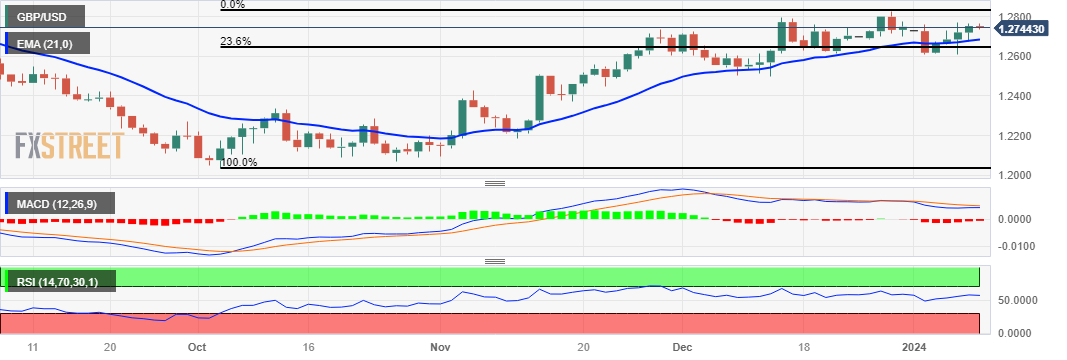
  • 21-day EMA at 1.2684 appears as an immediate support followed by the major level at 1.2650.
  • The lagging indicator MACD suggests a degree of caution among investors.

GBP/USD halts a four-day winning streak, trading lower near 1.2750 during the early European session on Tuesday. The GBP/USD pair is at a critical juncture, and the possibility of a break below the major level raises the potential for further downward pressure. The 21-day Exponential Moving Average (EMA) at 1.2684 serves as an immediate support level to monitor.

A breach below the 21-day EMA could signal increased selling pressure, and the pair might then approach the major support at 1.2650. This level, aligned with the 23.6% Fibonacci retracement at 1.2643, adds technical significance to the support zone.

The 14-day Relative Strength Index (RSI) being positioned above the 50 level is a positive sign, indicating bullish momentum for the GBP/USD pair. An RSI above 50 generally suggests that buying pressure is prevailing, and it aligns with the notion of an upward outlook for the pair.

In addition, the Moving Average Convergence Divergence (MACD) indicator also provides interesting insights. The fact that the MACD line is above the centerline is a bullish signal, suggesting potential upward momentum. However, the convergence below the signal line may indicate a degree of caution among investors.

On the upside, the GBP/USD pair could reach the previous week’s high at 1.2771. A breach above the latter could support the GBP/USD pair to explore the region around the psychological level at 1.2800 followed by December’s high at 1.2827.

GBP/USD: Daily Chart

GBP/USD: additional technical levels

Overview
Today last price1.275
Today Daily Change-0.0002
Today Daily Change %-0.02
Today daily open1.2752
 
Trends
Daily SMA201.2695
Daily SMA501.2555
Daily SMA1001.2448
Daily SMA2001.254
 
Levels
Previous Daily High1.2767
Previous Daily Low1.2674
Previous Weekly High1.2771
Previous Weekly Low1.2611
Previous Monthly High1.2828
Previous Monthly Low1.2501
Daily Fibonacci 38.2%1.2731
Daily Fibonacci 61.8%1.2709
Daily Pivot Point S11.2695
Daily Pivot Point S21.2637
Daily Pivot Point S31.2601
Daily Pivot Point R11.2788
Daily Pivot Point R21.2825
Daily Pivot Point R31.2882

Author

Akhtar Faruqui

Akhtar Faruqui is a Forex Analyst based in New Delhi, India. With a keen eye for market trends and a passion for dissecting complex financial dynamics, he is dedicated to delivering accurate and insightful Forex news and analysis.

More from Akhtar Faruqui
Share:

Markets move fast. We move first.

Orange Juice Newsletter brings you expert driven insights - not headlines. Every day on your inbox.

By subscribing you agree to our Terms and conditions.

Editor's Picks

EUR/USD moves sideways below 1.1800 on Christmas Eve

EUR/USD struggles to find direction and trades in a narrow channel below 1.1800 after posting gains for two consecutive days. Bond and stock markets in the US will open at the usual time and close early on Christmas Eve, allowing the trading action to remain subdued. 

GBP/USD keeps range around 1.3500 amid quiet markets

GBP/USD keeps its range trade intact at around 1.3500 on Wednesday. The Pound Sterling holds the upper hand over the US Dollar amid pre-Christmas light trading as traders move to the sidelines heading into the holiday season. 

Gold retreats from record highs, trades below $4,500

Gold retreats after setting a new record-high above $4,520 earlier in the day and trades in a tight range below $4,500 as trading volumes thin out ahead of the Christmas break. The US Dollar selling bias remains unabated on the back of dovish Fed expectations, which continues to act as a tailwind for the bullion amid persistent geopolitical risks.

Bitcoin slips below $87,000 as ETF outflows intensify, whale participation declines

Bitcoin price continues to trade around $86,770 on Wednesday, after failing to break above the $90,000 resistance. US-listed spot ETFs record an outflow of $188.64 million on Tuesday, marking the fourth consecutive day of withdrawals.

Economic outlook 2026-2027 in advanced countries: Solidity test

After a year marked by global economic resilience and ending on a note of optimism, 2026 looks promising and could be a year of solid economic performance. In our baseline scenario, we expect most of the supportive factors at work in 2025 to continue to play a role in 2026.

Avalanche struggles near $12 as Grayscale files updated form for ETF

Avalanche trades close to $12 by press time on Wednesday, extending the nearly 2% drop from the previous day. Grayscale filed an updated form to convert its Avalanche-focused Trust into an ETF with the US Securities and Exchange Commission.