GBP/USD Price Analysis: Consolidates around 1.2700 ahead of FOMC’s decision
- GBP/USD tumbles 0.14% due to disappointing UK employment data.
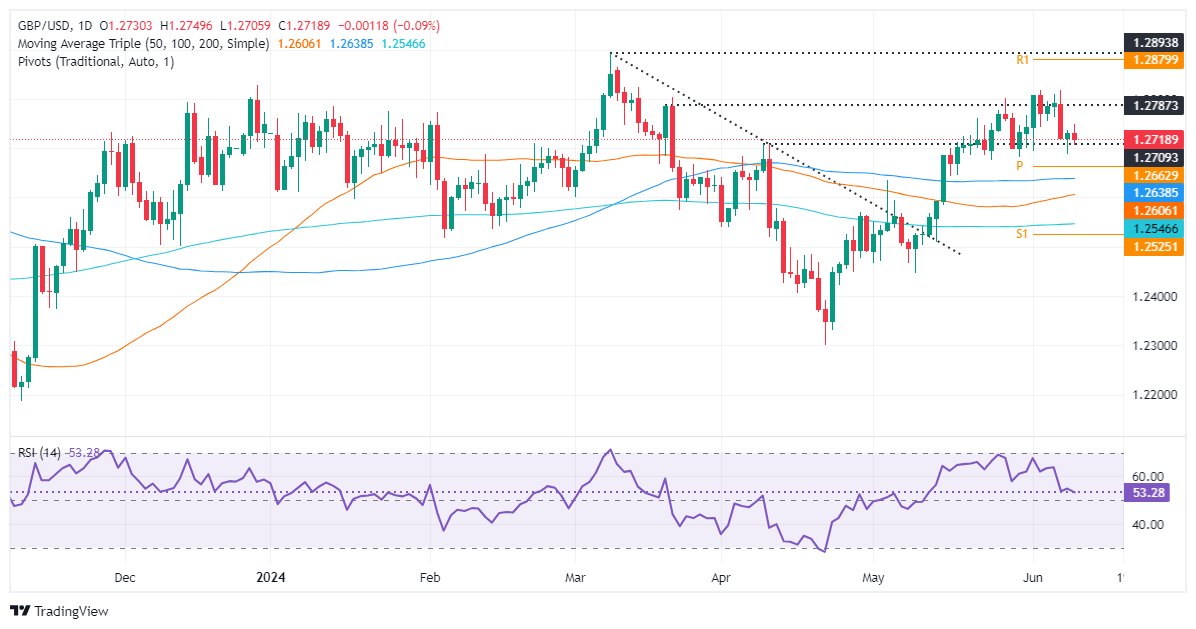
- Technical outlook shows neutral bias with momentum fading, consolidating between 1.2687-1.2750.
- A hawkish Fed could push GBP/USD below 1.2687, targeting 1.2643/37 and 1.2600; resistance at 1.2750 and 1.2800.

The GBP/USD dropped during the North American session after employment data from the UK was weaker than expected, undermining the Pound Sterling. Therefore, the major trades at 1.2711, down 0.14%.
GBP/USD Price Analysis: Technical outlook
From a daily chart perspective, the GBP/USD remains neutral-biased, consolidating at around 1.2687-1.2750 ahead of Wednesday's Federal Reserve monetary policy decision. Momentum suggests that buying pressure is fading, according to the Relative Strength Index (RSI), with sellers gathering traction.
Therefore, the Fed’s hawkish tilted hold decision could push the GBP/USD below the current week’s low of 1.2687, followed by the confluence of the 100-day moving average (DMA) and May 3 cycle high turned support at 1.2643/37, before diving to 1.2600.
On the flip side, if buyers lift the exchange rate past 1.2750, a challenge of the 1.2800 figure is on the cards.
GBP/USD Price Action – Daily Chart
British Pound PRICE Today
The table below shows the percentage change of British Pound (GBP) against listed major currencies today. British Pound was the strongest against the Euro.
| USD | EUR | GBP | JPY | CAD | AUD | NZD | CHF | |
|---|---|---|---|---|---|---|---|---|
| USD | 0.36% | 0.09% | 0.20% | 0.13% | 0.25% | 0.06% | 0.30% | |
| EUR | -0.36% | -0.26% | -0.15% | -0.22% | -0.08% | -0.30% | -0.05% | |
| GBP | -0.09% | 0.26% | 0.10% | 0.03% | 0.16% | -0.05% | 0.19% | |
| JPY | -0.20% | 0.15% | -0.10% | -0.08% | 0.03% | -0.17% | 0.08% | |
| CAD | -0.13% | 0.22% | -0.03% | 0.08% | 0.12% | -0.08% | 0.16% | |
| AUD | -0.25% | 0.08% | -0.16% | -0.03% | -0.12% | -0.21% | 0.02% | |
| NZD | -0.06% | 0.30% | 0.05% | 0.17% | 0.08% | 0.21% | 0.25% | |
| CHF | -0.30% | 0.05% | -0.19% | -0.08% | -0.16% | -0.02% | -0.25% |
The heat map shows percentage changes of major currencies against each other. The base currency is picked from the left column, while the quote currency is picked from the top row. For example, if you pick the British Pound from the left column and move along the horizontal line to the US Dollar, the percentage change displayed in the box will represent GBP (base)/USD (quote).
Author

Christian Borjon Valencia
FXStreet
Markets analyst, news editor, and trading instructor with over 14 years of experience across FX, commodities, US equity indices, and global macro markets.


