- GBP/USD gained traction for the second consecutive session on Tuesday.
- A modest USD strength seemed to cap the upside amid fresh Brexit jitters.
- Bears need to wait for a sustained break below ascending channel support.
The GBP/USD pair gained traction for the second consecutive session on Tuesday and climbed to 1.3800 neighbourhood during the early European session, albeit lacked follow-through. The uptick could be solely attributed to some cross-driven strength stemming from a fresh leg down in the EUR/GBP cross. That said, a modest US dollar strength kept a lid on any further gains for the major amid fresh Brexit jitters.
From a technical perspective, the GBP/USD pair has been showing some resilience near the 200-hour SMA. This is closely followed by the lower boundary of an ascending channel extending from the vicinity of the 1.3400 mark, or September swing lows. The latter, currently around mid-1.3700s, should now act as a key pivotal point for short-term traders. A convincing break below will set the stage for an extension of the recent rejection slide from the very important 200-day SMA.
GBP/USD 1-hour chart
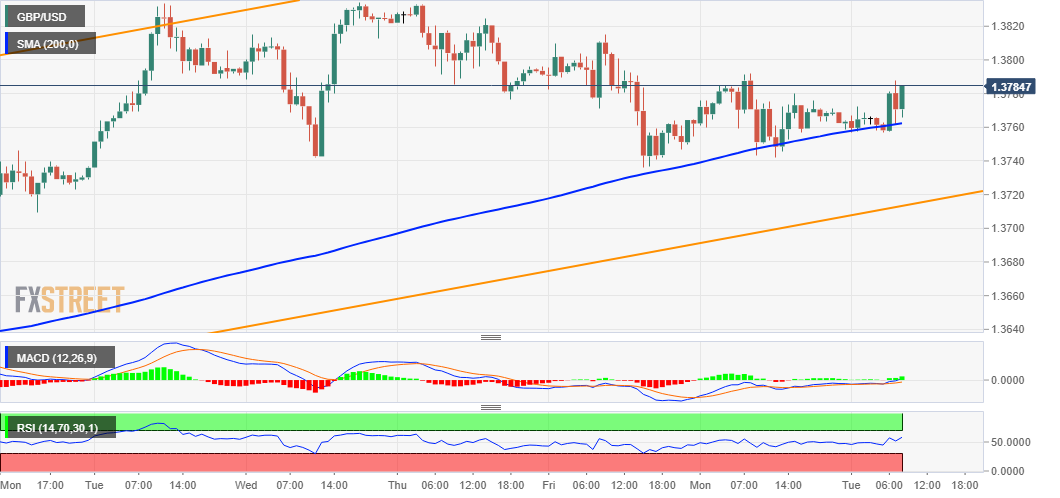
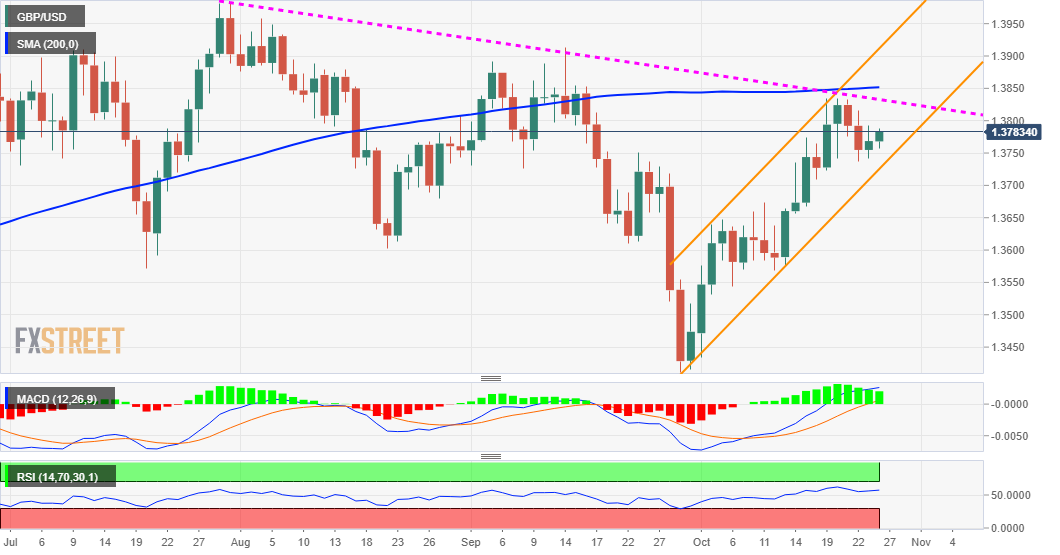
The GBP/USD pair might then accelerate the corrective decline towards testing the 1.3700 round-figure mark. The next relevant support is pegged near the 1.3675-70 horizontal zone, which if broken decisively would turn the pair vulnerable. Meanwhile, technical indicators on the daily chart – though have been losing positive traction – are still holding comfortably in the bullish territory. This, in turn, warrants caution before placing aggressive bearish bets around the GBP/USD pair.
On the flip side, any meaningful positive move beyond the 1.3800 mark might continue to confront stiff resistance near the 1.3830-35 confluence region. This comprises 200-day SMA and a downward sloping trend-line extending from late July. Some follow-through buying has the potential to lift the GBP/USD pair further towards challenging the trend-channel hurdle, currently around the 1.3885 region. A sustained strength beyond will be seen as a fresh trigger for bullish traders.
GBP/USD daily chart
Technical levels to watch
Information on these pages contains forward-looking statements that involve risks and uncertainties. Markets and instruments profiled on this page are for informational purposes only and should not in any way come across as a recommendation to buy or sell in these assets. You should do your own thorough research before making any investment decisions. FXStreet does not in any way guarantee that this information is free from mistakes, errors, or material misstatements. It also does not guarantee that this information is of a timely nature. Investing in Open Markets involves a great deal of risk, including the loss of all or a portion of your investment, as well as emotional distress. All risks, losses and costs associated with investing, including total loss of principal, are your responsibility. The views and opinions expressed in this article are those of the authors and do not necessarily reflect the official policy or position of FXStreet nor its advertisers. The author will not be held responsible for information that is found at the end of links posted on this page.
If not otherwise explicitly mentioned in the body of the article, at the time of writing, the author has no position in any stock mentioned in this article and no business relationship with any company mentioned. The author has not received compensation for writing this article, other than from FXStreet.
FXStreet and the author do not provide personalized recommendations. The author makes no representations as to the accuracy, completeness, or suitability of this information. FXStreet and the author will not be liable for any errors, omissions or any losses, injuries or damages arising from this information and its display or use. Errors and omissions excepted.
The author and FXStreet are not registered investment advisors and nothing in this article is intended to be investment advice.
Recommended content
Editors’ Picks
USD/JPY holds positive ground around 151.50 following Japanese CPI data
The USD/JPY pair holds positive ground for the second consecutive day near 151.45 on Friday during the early Asian trading hours. The cautious approach from the Bank of Japan to keep monetary conditions accommodative exerts some selling pressure on the Japanese Yen.
AUD/USD holds above 0.6500 in thin trading
The Australian Dollar managed to recover ground against its American rival after AUD/USD fell to 0.6484. The upbeat tone of Wall Street underpinned the Aussie despite broad US Dollar strength and tepid Australian data.
Gold price finishes Thursday’s session set to reach new all-time highs
Gold price rallied during the North American session on Thursday and hit a new all-time high of $2,225 in the mid-North American session. Precious metal prices are trending higher even though US Treasury yields are advancing, underpinning the Greenback.
Top 3 Price Prediction BTC, ETH, XRP: Retail watches from the sidelines with a bias for shorts
Bitcoin is showing strength as markets head into the Easter holidays. As it rises, altcoins are following suit, with Ethereum and Ripple posting almost similar gains. Meanwhile, there remains an unfilled CME Gap, with a lot of liquidity also resting above and below BTC price.
Bears have been standing before a steamroller so far this year
Despite a pushback on rate cuts from Christopher Waller, and what was supposed to be cautious trading sentiment ahead of critical US inflation data released later on Friday, the S&P 500 rose on Thursday, marking its best first-quarter performance in five years.