|

GBP/USD Price Analysis: Cable finds support at 20-EMA around 1.1600

  • Cable bulls are eyeing more upside after a time correction to near the 20-EMA around 1.1600.
  • The market mood seems still upbeat despite a rise in returns from US government bonds.
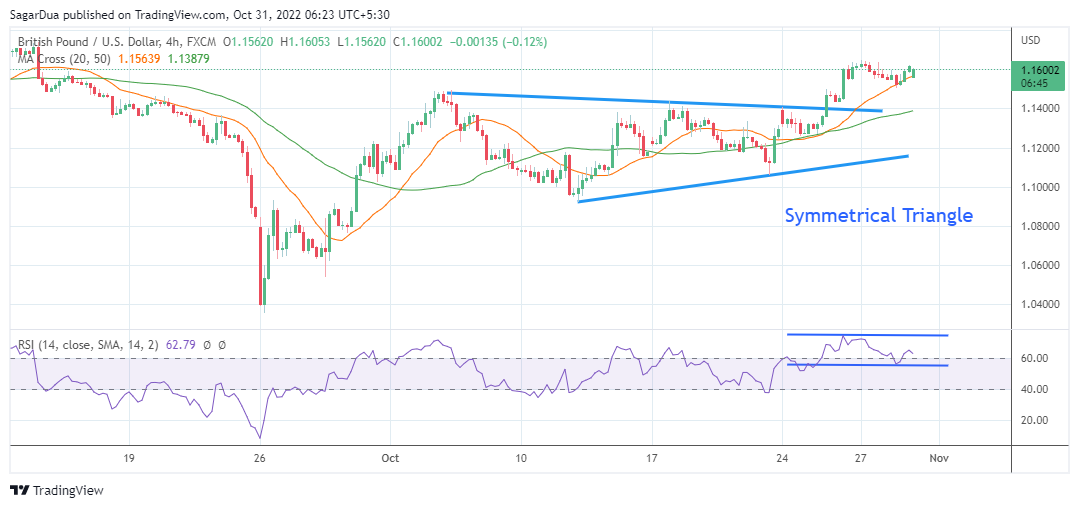
  • The RSI (14) has shifted into the bullish range of 60.00-80.00, which indicates more upside ahead.

The GBP/USD pair has overstepped the immediate resistance of 1.1600 in the Asian session amid a subdued performance by the US dollar index (DXY). The DXY is performing lackluster in a limited range ahead of the monetary policy decision by the Federal Reserve (Fed).

Meanwhile, the risk-on impulse still seems solid despite an expansion in 10-year US Treasury yields to 4.05%. S&P500 futures have extended their losses to 0.3% after registering 4% weekly gains.

On a four-hour scale, pound bulls have displayed a perpendicular rally after a breakout of the symmetrical triangle chart pattern. The upward-sloping trendline of the chart pattern was placed from October 12 low at 1.0924 while the downward-sloping trendline was plotted from October 5 high at 1.1496.

The asset has rested after a sharp upside move to near the 20-period Exponential Moving Average (EMA) at 1.1580, which is providing a bargain opportunity to the market participants for the execution of longs. Also, the 50-period Exponential Moving Average (EMA) at 1.1400 is advancing, which adds to the upside filters.

Meanwhile, the Relative Strength Index (RSI) (14) is oscillating in a bullish range of 60.00-80.00, which indicates more upside ahead.

Going forward, a decisive break above Thursday’s high at 1.1640 will send the cable towards September 13 high at 1.1732, followed by the round-level resistance at 1.1900.

On the flip side, a downside below the round-level support of 1.1400 will drag the asset toward Tuesday’s low at 1.1269. A slippage below the latter will drag the cable towards a two-week low at 1.1060.

GBP/USD four-hour chart

GBP/USD

Overview
Today last price1.16
Today Daily Change-0.0013
Today Daily Change %-0.11
Today daily open1.1613
 
Trends
Daily SMA201.1298
Daily SMA501.1381
Daily SMA1001.1734
Daily SMA2001.2366
 
Levels
Previous Daily High1.1624
Previous Daily Low1.1504
Previous Weekly High1.1646
Previous Weekly Low1.1258
Previous Monthly High1.1738
Previous Monthly Low1.0339
Daily Fibonacci 38.2%1.1578
Daily Fibonacci 61.8%1.155
Daily Pivot Point S11.1537
Daily Pivot Point S21.146
Daily Pivot Point S31.1417
Daily Pivot Point R11.1656
Daily Pivot Point R21.17
Daily Pivot Point R31.1776

Author

Sagar Dua

Sagar Dua

FXStreet

Sagar Dua is associated with the financial markets from his college days. Along with pursuing post-graduation in Commerce in 2014, he started his markets training with chart analysis.

More from Sagar Dua
Share:

Markets move fast. We move first.

Orange Juice Newsletter brings you expert driven insights - not headlines. Every day on your inbox.

By subscribing you agree to our Terms and conditions.

Editor's Picks

EUR/USD ticks lower following the release of FOMC Minutes

The US Dollar found some near-term demand following the release of the FOMC meeting minutes, with the EUR/USD pair currently piercing the 1.1750 threshold. The document showed officials are still willing to trim interest rates. Meanwhile, thinned holiday trading keeps major pairs confined to familiar levels.

GBP/USD remains sub- 1.3500, remains in the red

The GBP/USD lost traction early in the American session, maintaining the sour tone and trading around 1.3460 following the release of the FOMC meeting minutes. Trading conditions remain thin ahead of the New Year holiday, limiting the pair's volatility.

Gold stable above $4,350 as the year comes to an end

Gold price got to recover some modest ground on Tuesday, holding on to intraday gains and changing hands at $4,360 a troy ounce in the American afternoon. The bright metal showed no reaction to the release of the FOMC December meeting minutes.

Ethereum: ETH holds above $2,900 despite rising selling activity

Ethereum (ETH) held the $2,900 level despite seeing increased selling pressure over the past week. The Exchange Netflow metric showed deposits outweighed withdrawals by about 400K ETH. The high value suggests rising selling activity amid the holiday season.

Economic outlook 2026-2027 in advanced countries: Solidity test

After a year marked by global economic resilience and ending on a note of optimism, 2026 looks promising and could be a year of solid economic performance. In our baseline scenario, we expect most of the supportive factors at work in 2025 to continue to play a role in 2026.

Crypto market outlook for 2026

Year 2025 was volatile, as crypto often is.  Among positive catalysts were favourable regulatory changes in the U.S., rise of Digital Asset Treasuries (DAT), adoption of AI and tokenization of Real-World-Assets (RWA).