|

GBP/USD Price Analysis: Cable buyers approach 1.2400 resistance confluence

  • GBP/USD grinds near intraday high, extends previous day’s rebound from two-month low.
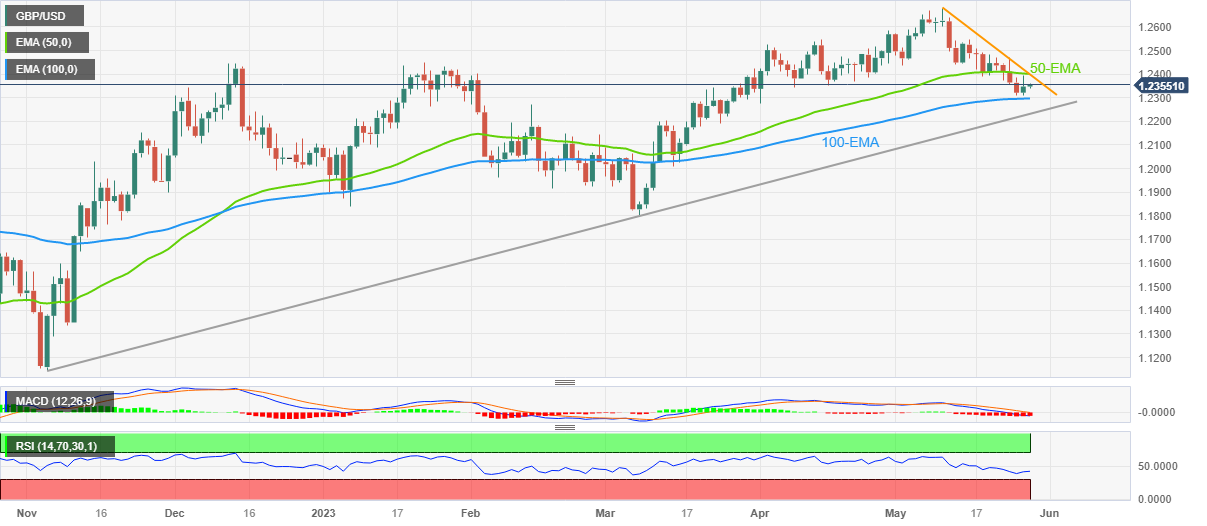
  • Convergence of 50-EMA, 13-day-old descending trend line challenges Cable pair buyers.
  • Downbeat RSI underpins corrective bounce off 100-EMA, ascending trend line from last November also checks Pound Sterling bears.

GBP/USD pares monthly losses, the first in three, around 1.2360 during early Monday as markets in the UK and the US are off for the Memorial Day holiday. In doing so, the Cable pair extends the previous day’s recovery from the last levels since early April as the US Dollar retreats from a multi-day high despite the Biden-McCarthy deal on debt ceiling extension.

Also read: GBP/USD recovers from 1.2350 as USD Index drops amid US debt-ceiling raise approval

That said, the below 50 levels of the RSI line, placed at 14, joins the 100-Exopnential Moving Average (EMA) to put a floor under the Pound Sterling pair around the 1.2300 round figure.

Even so, the bearish MACD signals and the 1.2400 resistance confluence, including the 50-EMA and a two-week-old descending trend line, restrict immediate upside moves of the GBP/USD pair.

Following that, the tops marked market during late 2022 and in the last month, around 1.2440 and 1.2585 in that order, could act as the final defense of the Cable bears.

On the contrary, a downside break of the 100-EMA level surrounding 1.2300 isn’t an open invitation to the Pound Sterling bears as an upward-sloping support line from November 2022, close to 1.2230 could restrict further downside of the pair.

Though, a clear downside break of the 1.2230 support won’t hesitate to challenge the 1.2000 round figure on its way to meet early 2023 low surrounding 1.1840.

GBP/USD: Daily chart

Trend: Limited recovery expected

Additional important levels

Overview
Today last price1.2357
Today Daily Change0.0009
Today Daily Change %0.07%
Today daily open1.2348
 
Trends
Daily SMA201.249
Daily SMA501.2435
Daily SMA1001.2288
Daily SMA2001.1978
 
Levels
Previous Daily High1.2395
Previous Daily Low1.2311
Previous Weekly High1.2472
Previous Weekly Low1.2308
Previous Monthly High1.2584
Previous Monthly Low1.2275
Daily Fibonacci 38.2%1.2363
Daily Fibonacci 61.8%1.2343
Daily Pivot Point S11.2307
Daily Pivot Point S21.2267
Daily Pivot Point S31.2223
Daily Pivot Point R11.2391
Daily Pivot Point R21.2435
Daily Pivot Point R31.2476

Author

Anil Panchal

Anil Panchal

FXStreet

Anil Panchal has nearly 15 years of experience in tracking financial markets. With a keen interest in macroeconomics, Anil aptly tracks global news/updates and stays well-informed about the global financial moves and their implications.

More from Anil Panchal
Share:

Markets move fast. We move first.

Orange Juice Newsletter brings you expert driven insights - not headlines. Every day on your inbox.

By subscribing you agree to our Terms and conditions.

Editor's Picks

EUR/USD bounces toward 1.1750 as US Dollar loses strength

EUR/USD returned to the 1.1750 price zone in the American session on Friday, despite falling Wall Street, which indicates risk aversion. Trading conditions remain thin following the New Year holiday and ahead of the weekend, with the focus shifting to US employment and European data scheduled for next week.

GBP/USD nears 1.3500, holds within familiar levels

After testing 1.3400 on the last day of 2025, GBP/USD managed to stage a rebound. Nevertheless, the pair finds it difficult to gather momentum and trades with modest intraday gains at around 1.3490 as market participants remain in holiday mood.

Gold trims intraday gains, approaches $4,300

Gold retreated sharply from the $4,400  area and trades flat for the day in the $4,320 price zone. Choppy trading conditions exacerbated the intraday decline, although XAU/USD bearish case is out of the picture, considering growing expectations for a dovish Fed and persistent geopolitical tensions.

Cardano gains early New Year momentum, bulls target falling wedge breakout

Cardano kicks off the New Year on a positive note and is extending gains, trading above $0.36 at the time of writing on Friday. Improving on-chain and derivatives data point to growing bullish interest, while the technical outlook keeps an upside breakout in focus.

Economic outlook 2026-2027 in advanced countries: Solidity test

After a year marked by global economic resilience and ending on a note of optimism, 2026 looks promising and could be a year of solid economic performance. In our baseline scenario, we expect most of the supportive factors at work in 2025 to continue to play a role in 2026.

Crypto market outlook for 2026

Year 2025 was volatile, as crypto often is.  Among positive catalysts were favourable regulatory changes in the U.S., rise of Digital Asset Treasuries (DAT), adoption of AI and tokenization of Real-World-Assets (RWA).