|

GBP/USD Price Analysis: Bulls struggle near two-month top, 5-day SMA offers immediate support

  • GBP/USD fails to keep the highest levels since September 07.
  • Bullish MACD, upbeat RSI conditions favor further upside to two-month-old resistance line.
  • Bears will look for entry on the break of an ascending trend line from May 18.

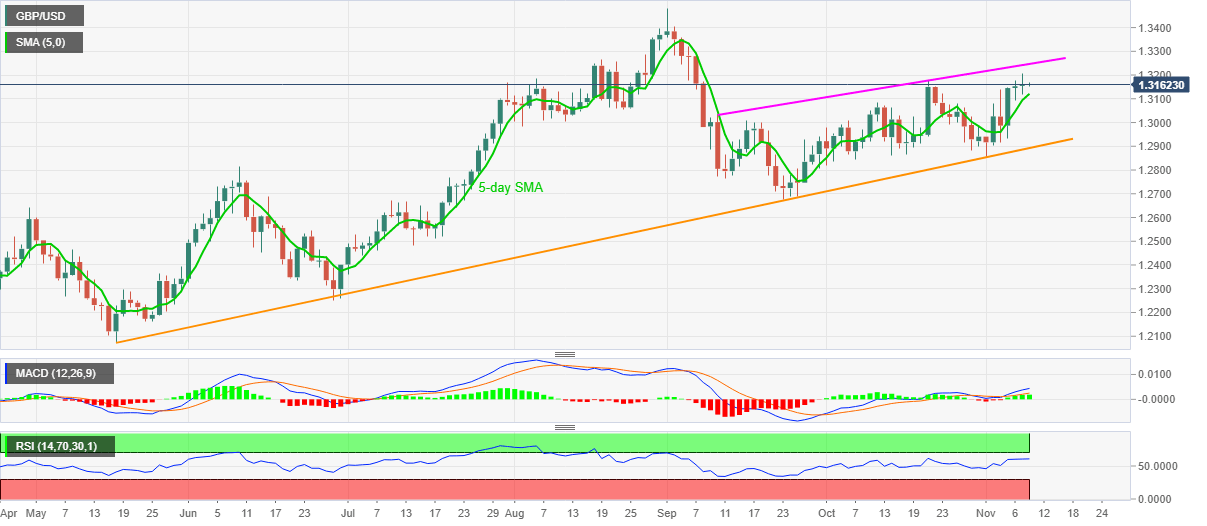
GBP/USD recedes to 1.3160 during the initial hour of Tuesday’s Asian session. The pair refreshed the two-month peak on Monday but failed to stay positive beyond 1.3200.

However, bullish signals from the MACD joins strong RSI, not near the overbought region, favor the GBP/USD buyers to keep the optimism while targeting a resistance line stretched from September 10, at 1.3246 now. In doing so, a clear break above the recent high of 1.3208 becomes necessary.

While the quote is likely to post another U-turn from the mid-1.3200 area, any further upside can be challenged by the August 18 high near 1.3270, a break of which could challenge the yearly top surrounding 1.3485.

Alternatively, a downside break of 5-day SMA, currently near 1.3120 will aim for the 1.3100 and the 1.3000 round-figures as the next rest-points before highlighting a multi-day-old support line close to 1.2890.

If at all the GBP/USD bears manage to conquer the state support line, September lows near 1.2675 will pop-up on their radars with the monthly bottom around 1.2850 likely acting as a buffer.

GBP/USD daily chart
Trend: Bullish

Additional important levels

Overview
Today last price1.3159
Today Daily Change6 pips
Today Daily Change %0.05%
Today daily open1.3153
 
Trends
Daily SMA201.3008
Daily SMA501.2983
Daily SMA1001.2903
Daily SMA2001.2707
 
Levels
Previous Daily High1.3177
Previous Daily Low1.3092
Previous Weekly High1.3177
Previous Weekly Low1.2854
Previous Monthly High1.3177
Previous Monthly Low1.282
Daily Fibonacci 38.2%1.3145
Daily Fibonacci 61.8%1.3125
Daily Pivot Point S11.3105
Daily Pivot Point S21.3056
Daily Pivot Point S31.302
Daily Pivot Point R11.3189
Daily Pivot Point R21.3225
Daily Pivot Point R31.3274

Author

Anil Panchal

Anil Panchal

FXStreet

Anil Panchal has nearly 15 years of experience in tracking financial markets. With a keen interest in macroeconomics, Anil aptly tracks global news/updates and stays well-informed about the global financial moves and their implications.


More from Anil Panchal
Share:

Editor's Picks

GBP/USD off highs, back to 1.3620

GBP/USD remains slightly on the defensive at the end of the week, receding to the low 1.3600s after hitting fresh tops past 1.3670 earlier in the day. Cable’s correction comes after two daily gains in a row and amid a tepid advance in the Greenback, while poor UK data also accompany the downside.

EUR/USD treads water below 1.1700

EUR/USD now trades with modest losses around 1.1670 following another unsuccessful atempt to advance past 1.1700 the figure in a convincing fashion. The pair’s decline follows a maginal rebound in the US Dollar as market participants continue to assess recent US data as well as developments from the US bond market.

Gold trims gains, recedes to the sub-$4,600 area

Gold rapidly leaves behind Thursday’s inconclusive price action and advances markedly on Friday, briefly surpassing the $4,600 mark per troy ounce to hit three-month peaks. Meanwhile, the precious metal’s solid performance comes despite marginal gains in the buck coupled with another day of rising US Treasury yields across the curve.

Week ahead: Fed’s Jackson Hole and Nvidia earnings to dictate markets
The new Fed chair, Kevin Warsh, has made few public appearances since taking the central bank helm in May, yet he’s found it difficult to steer off controversy. Question marks about his relations with the President, Donald Trump, continue to swirl, while markets are still trying to make sense of his approach to monetary policy.
CFTC Report: Oil positioning rebounds; VIX and Yen exposure turn more bearish
The week in one sentence: Speculative positioning turned more constructive in the week to August 18. WTI recorded the largest increase, followed by a sharp narrowing in CAD net shorts. VIX and JPY positioning moved the other way, while Gold remained the clearest crowded long despite a softer spot price.
$20 billion offered, $2 billion taken: Why Treasury doubled its buyback cap

The US Treasury moved off its own calendar on Wednesday, and that is the part worth sitting with. At 12:32 GMT, the department said it would at least double the size of liquidity support buyback operations in the 10-year to 20-year and 20-year to 30-year sectors, lifting the maximum from $2 billion per operation to at least $4 billion, effective September 9 and running to November 4.