GBP/USD Price Analysis: Bulls prepare an assault of 1.2400 and beyond
- The daily chart portrays that the GBP/USD is still upward biased.
- Short term, the GBP/USD breaking a downslope trendline paved the way for further upside.
- GBP/USD Price Analysis: Intraday speaking, a test of 1.2400 is on the cards, followed by 1.2440.

The GBP/USD is trading almost flat as the Asian Pacific session begins. On Wednesday, the GBP/USD closed on a higher note, up by a half percent (0.50%), but fell short of achieving a daily close at 1.2400. Nevertheless, the uptrend remains intact, and the GBP/USD exchanges hands at 1.2392, registering minimal losses of 0.04%.
GBP/USD Price Analysis: Technical outlook
From a daily chart perspective, the GBP/USD remains upward biased, with sellers failing to drag prices below the 20-day Exponential Moving Average (EMA) at 1.2254. To further extend its uptrend, GBP/USD bulls need to reclaim 1.2443, which would exacerbate a rally towards June’s high of 1.2597, shy of the 1.2600 figure.
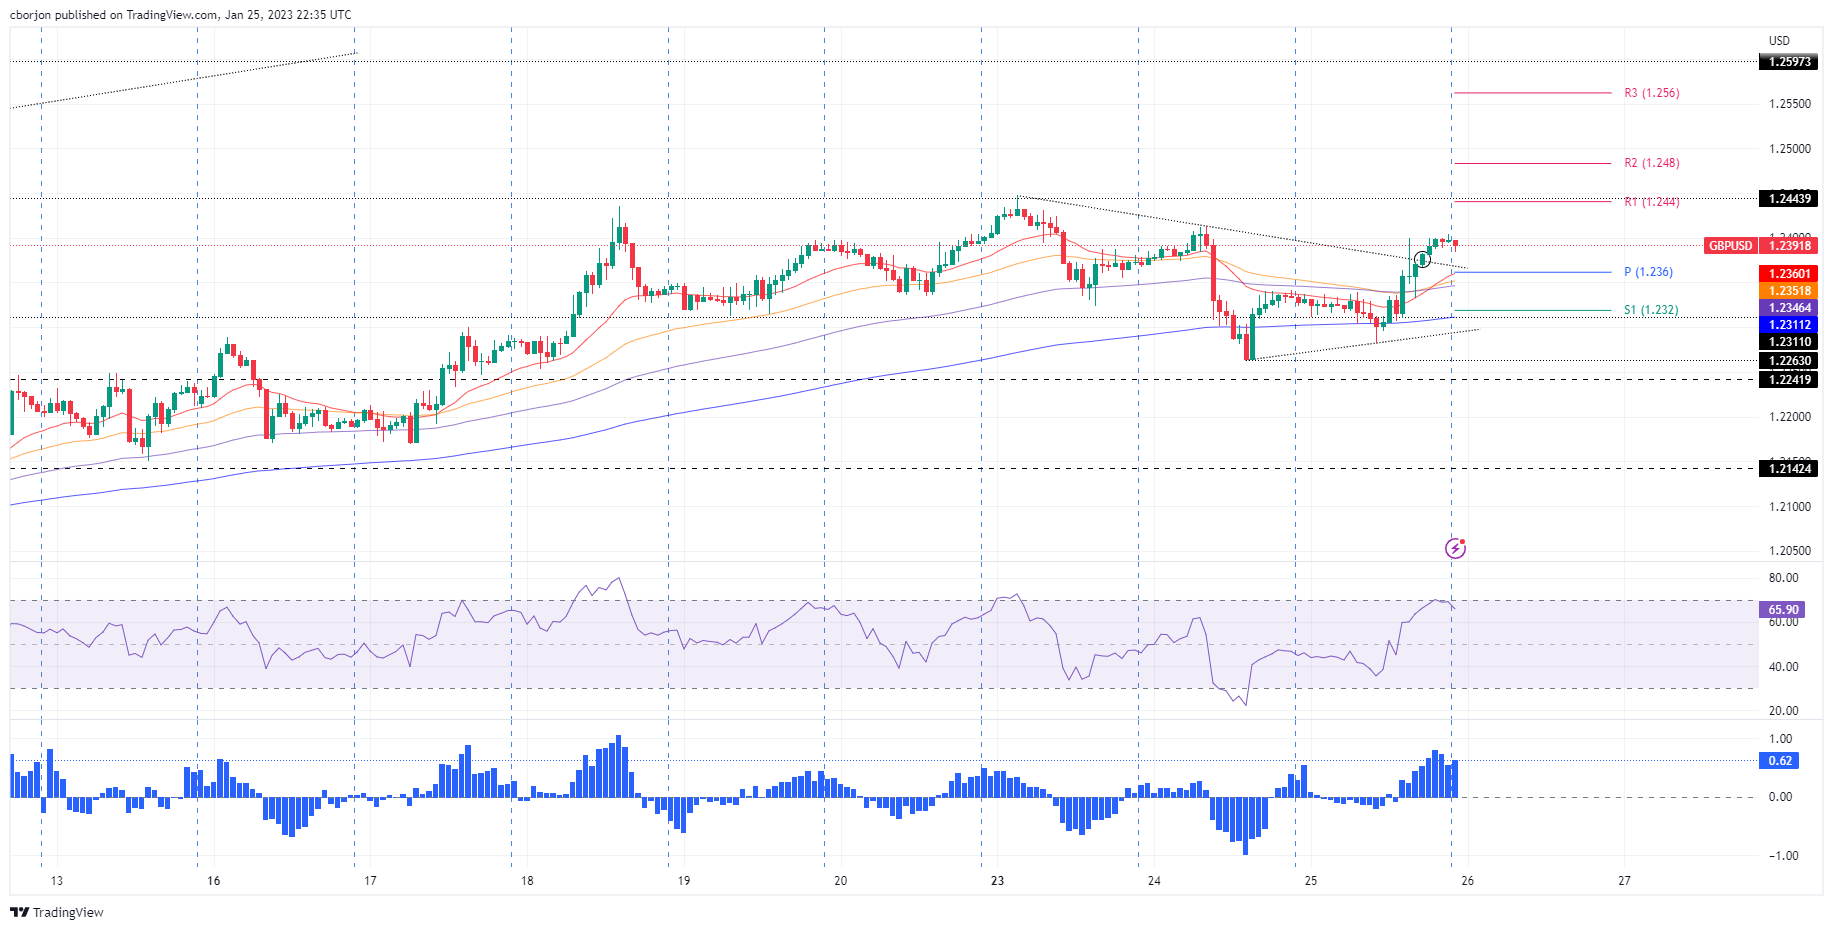
Intraday speaking, the GBP/USD is neutral to upward biased. After breaking above a downslope resistance trendline drawn from January 23 highs, broken around 1.2370/75, opened the door to challenge the 1.2400 mark. Nonetheless, the Relative Strength Index (RSI) slope is aiming downward, which suggests that a pullback to the daily pivot point level at 1.2363 is on the cards. Following that, the GBP/USD might print a leg up towards 1.2400, followed by the R1 daily pivot at 1.2440, followed by the R2 pivot at 1.2483.
GBP/USD Key Technical Levels
Author

Christian Borjon Valencia
FXStreet
Markets analyst, news editor, and trading instructor with over 14 years of experience across FX, commodities, US equity indices, and global macro markets.


