|

GBP/USD Price Analysis: Bulls have the upper hand above 100-DMA, move beyond 1.3600 awaited

  • GBP/USD was seen consolidating its recent gains to a near two-month high.
  • The set-up supports prospects for a further near-term appreciating move.
  • Any meaningful dip might still be seen as an opportunity for bullish traders.

The GBP/USD pair extended its sideways consolidative price action and remained confined in a narrow trading band, just below the 1.3600 mark through the mid-European session.

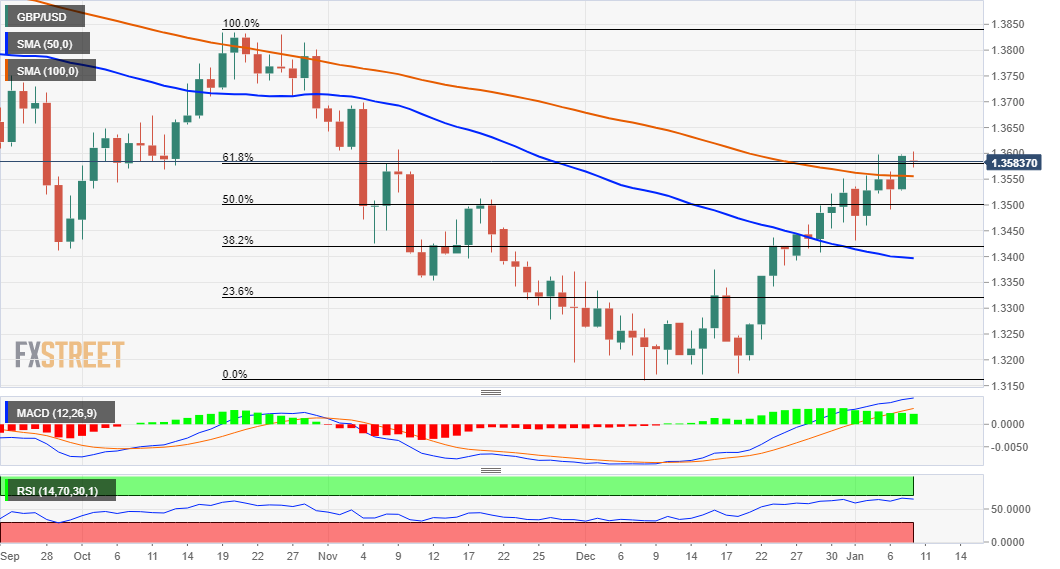
From a technical perspective, acceptance above the 100-day SMA supports prospects for an extension of the recent appreciating move further beyond the 61.8% Fibonacci level of the 1.3834-1.3161 fall. Some follow-through buying beyond the 1.3600 mark will reaffirm the positive outlook.

The GBP/USD pair might then accelerate the momentum towards testing a descending trend-line hurdle, around the 1.3675 region. The mentioned barrier extends from July 2021 swing high and should act as a key pivotal point, which if cleared will be seen as a fresh trigger for bullish traders.

On the flip side, the 100-day SMA, currently around mid-1.3500s, now seems to protect the immediate downside. Any subsequent decline might still be seen as a buying opportunity and remain limited near the key 1.3500 psychological mark, which coincides with the 50% Fibo. level.

A convincing break below the mentioned support levels could prompt some technical selling and drag the GBP/USD pair to the 1.3460-55 region en-route the 1.3430 area. This is followed by the 38.2% Fibo. level/50-day SMA confluence resistance breakpoint, near the 1.3400 round figure.

GBP/USD daily chart

fxsoriginal

Technical levels to watch

GBP/USD

Overview
Today last price1.3582
Today Daily Change-0.0013
Today Daily Change %-0.10
Today daily open1.3595
 
Trends
Daily SMA201.34
Daily SMA501.3399
Daily SMA1001.3557
Daily SMA2001.374
 
Levels
Previous Daily High1.3597
Previous Daily Low1.3528
Previous Weekly High1.3599
Previous Weekly Low1.3431
Previous Monthly High1.355
Previous Monthly Low1.3161
Daily Fibonacci 38.2%1.3571
Daily Fibonacci 61.8%1.3554
Daily Pivot Point S11.3549
Daily Pivot Point S21.3504
Daily Pivot Point S31.348
Daily Pivot Point R11.3619
Daily Pivot Point R21.3643
Daily Pivot Point R31.3688

Author

Haresh Menghani

Haresh Menghani is a detail-oriented professional with 10+ years of extensive experience in analysing the global financial markets.

More from Haresh Menghani
Share:

Editor's Picks

EUR/USD weakens below 1.1700 as Middle East tensions drive US Dollar strength

The EUR/USD pair trades with mild losses around 1.1685, the lowest since late January, during the early Asian session on Tuesday. The US Dollar gathers strength against the Euro as escalating tensions in the Middle East boost safe-haven currencies. The preliminary reading of the Harmonized Index of Consumer Prices from the Eurozone will be published later on Tuesday.  

GBP/USD hovers around 1.3400 with bearish pressure intact

GBP/USD edges higher after three days of losses, trading around 1.3400 during the Asian hours on Tuesday. The technical analysis of the daily chart indicates an ongoing bearish bias, as the pair trades within a descending channel pattern.

Gold defends bids as US-Iran war continues to fuel safe-haven flows

Gold retains positive bias for the fifth consecutive day on Tuesday as rising geopolitical tensions in the Middle East continue to underpin safe-haven assets. However, a bullish US Dollar keeps the bullion below its highest level since late January, set on Monday, warranting caution before positioning for any further appreciation.

Strategy lifts holdings to 3.4% of Bitcoin's total supply amid inflows into crypto products

Strategy continued its accumulation of the top crypto last week, acquiring 3,015 BTC for $204 million amid renewed interest in crypto products after four weeks of outflows.

The market is not panicking it is repricing the probability distribution of Oil and time

At the end of the day, markets do not trade morality or geopolitics. They trade transmission channels. And the only channel that truly matters in this maelstrom runs through the price of energy and the time value of money.

Grass 20% bullish breakout defies broader market weakness

Grass (GRASS) is edging up above $0.30 at the time of writing on Monday. The token’s notable 20% intraday surge stands out amid heightened volatility in the broader crypto market.