GBP/USD Price Analysis: Bulls guarding weekly support, eyes on correction
- GBP/USD bulls seeking a break of 1.2765 in the sessions ahead.
- Bulls eye a significant correction from weekly support.

GBP/USD is an interesting schematic on the charts. Following a negative start to the week, where the weekly chart has extended further to the downside, there are now prospects of a meaningful correction from what could prove to be a firm area of support. The following analysis illustrates this from a bullish bias across the weekly, daily and hourly time frames.
GBP/USD weekly chart
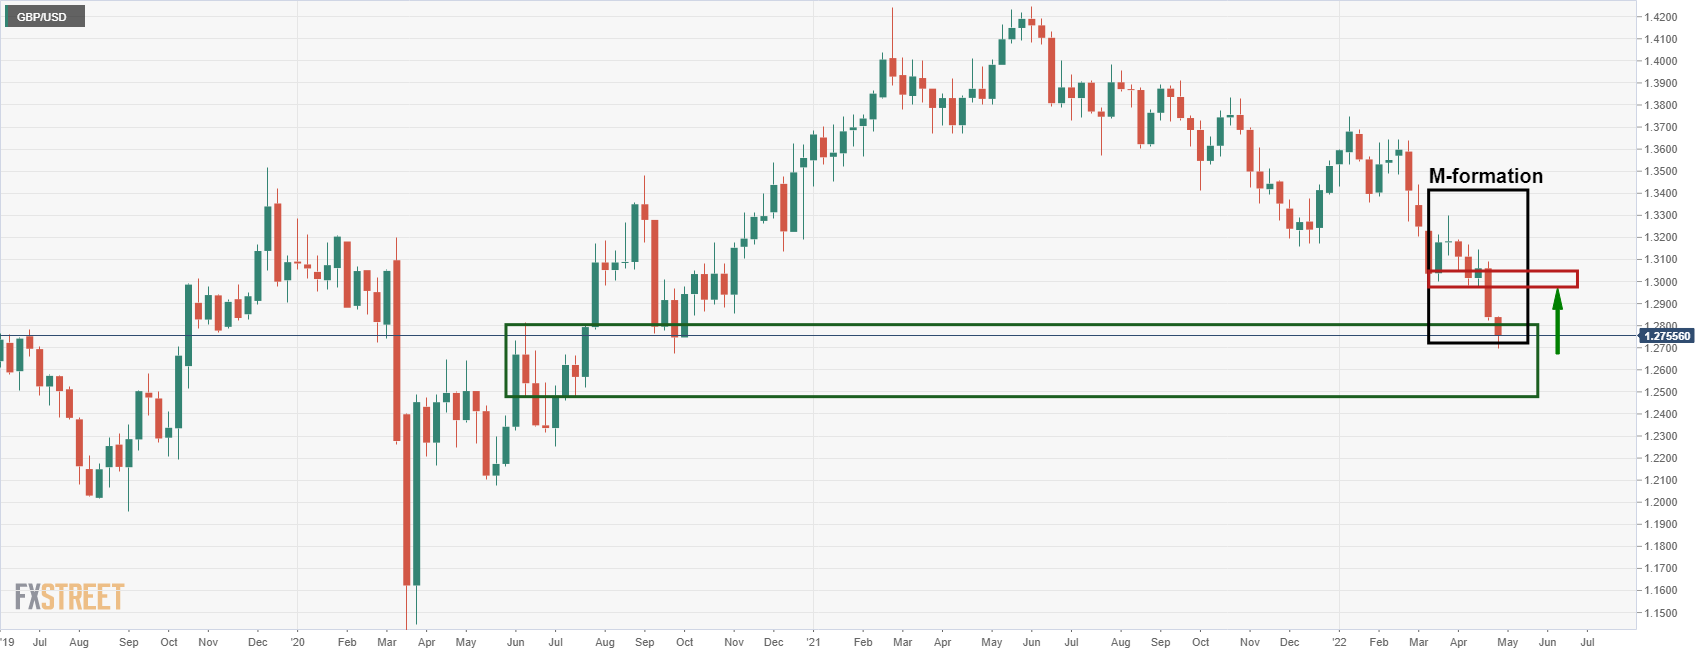
The weekly chart's demand zone could prove to be an interim level of support. The M-formation is a reversion pattern and the price might be expected to retrace towards the old support near 1.2970.
GBP/USD daily chart
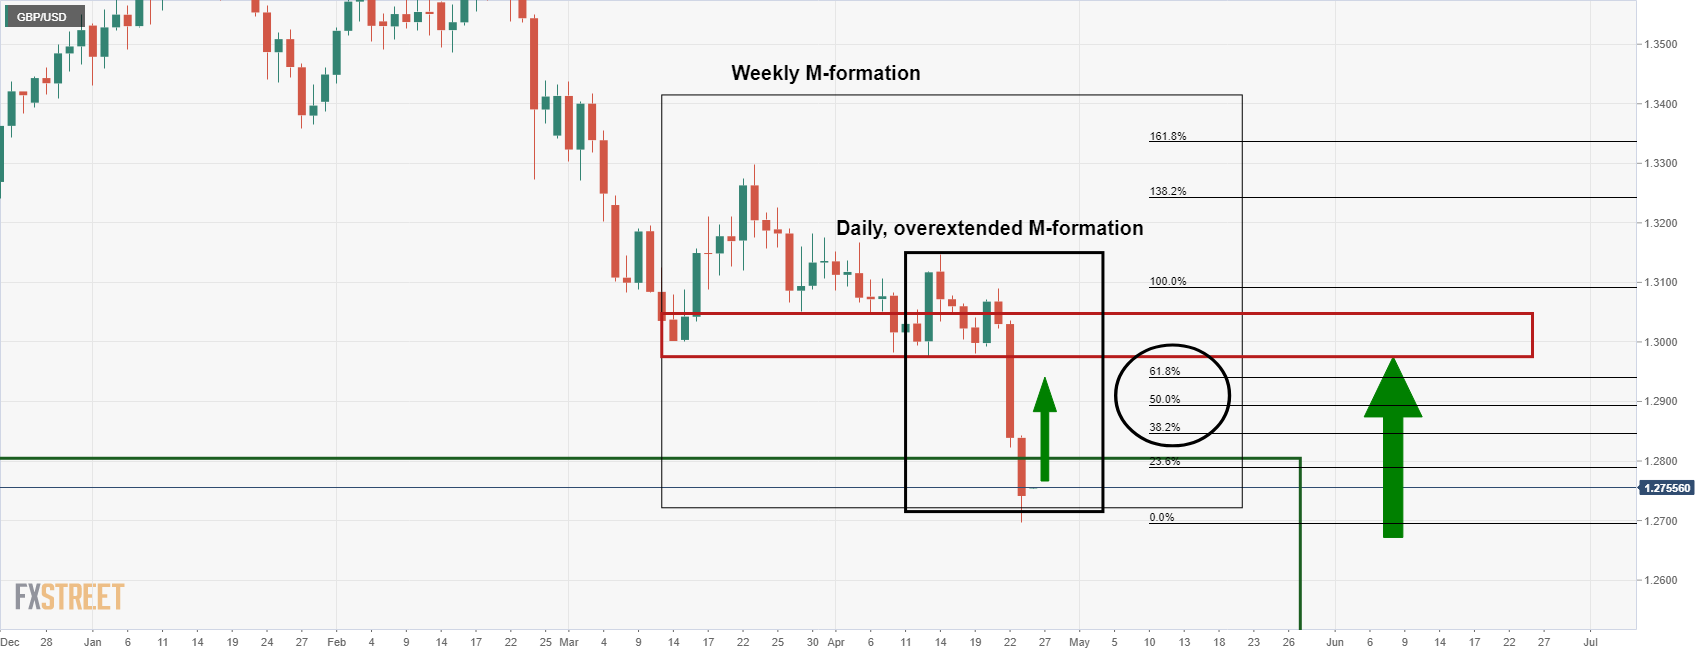
The daily chart also presents an M-formation. However, it is overextended which might see the bears stepping in before the weekly target. The Fibonacci scale can be monitored for potential areas of resistance between the 38.2%, 50% and 61.8% ratios.
GBP/USD H1 chart
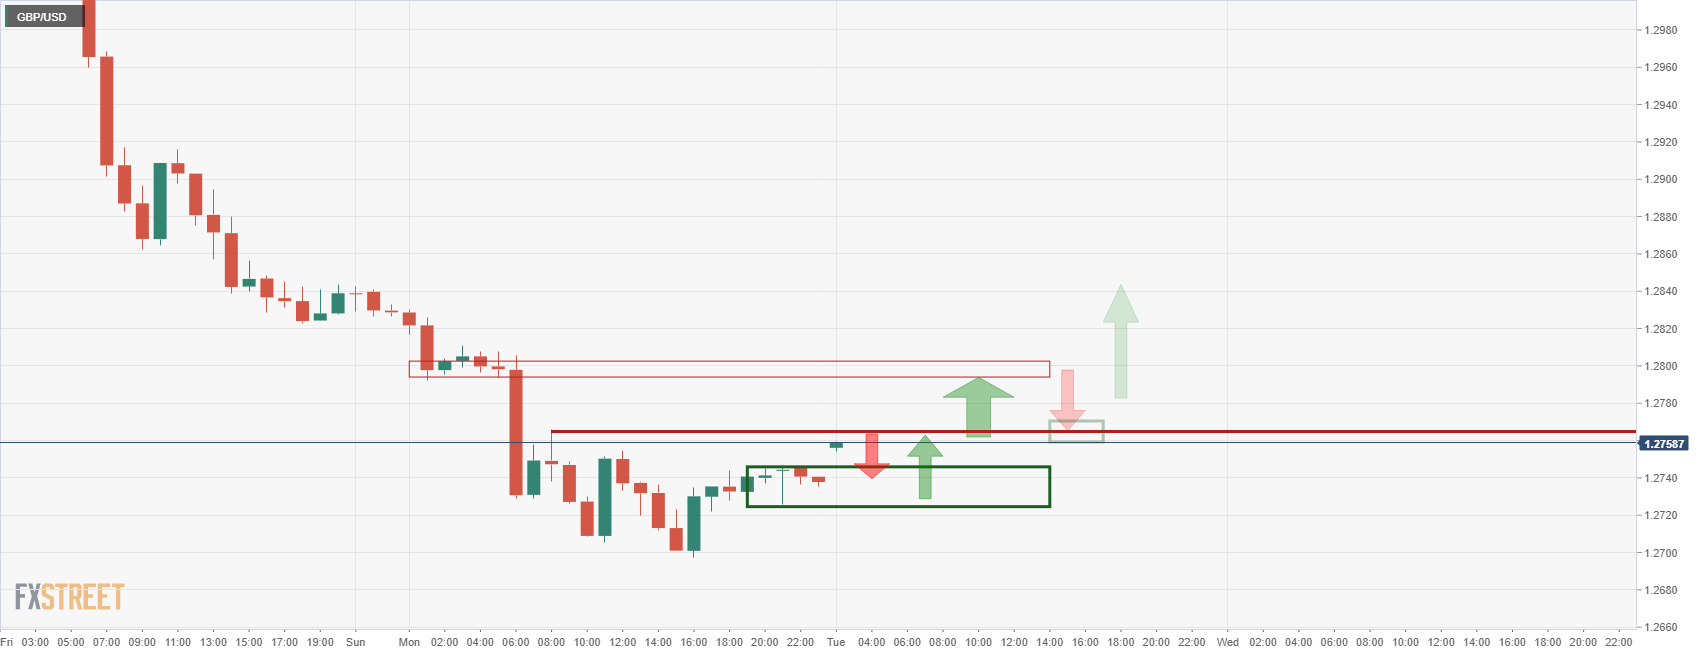
Meanwhile, the price is accumulating on the hourly chart but it has a layer of resistance to get through if the bulls are going to get back control. 1.2765 is key for the immediate future in this respect.
Author

Ross J Burland
FXStreet
Ross J Burland, born in England, UK, is a sportsman at heart. He played Rugby and Judo for his county, Kent and the South East of England Rugby team.


