GBP/USD Price Analysis: Bulls attack key Fibonacci retracement level above 1.3700
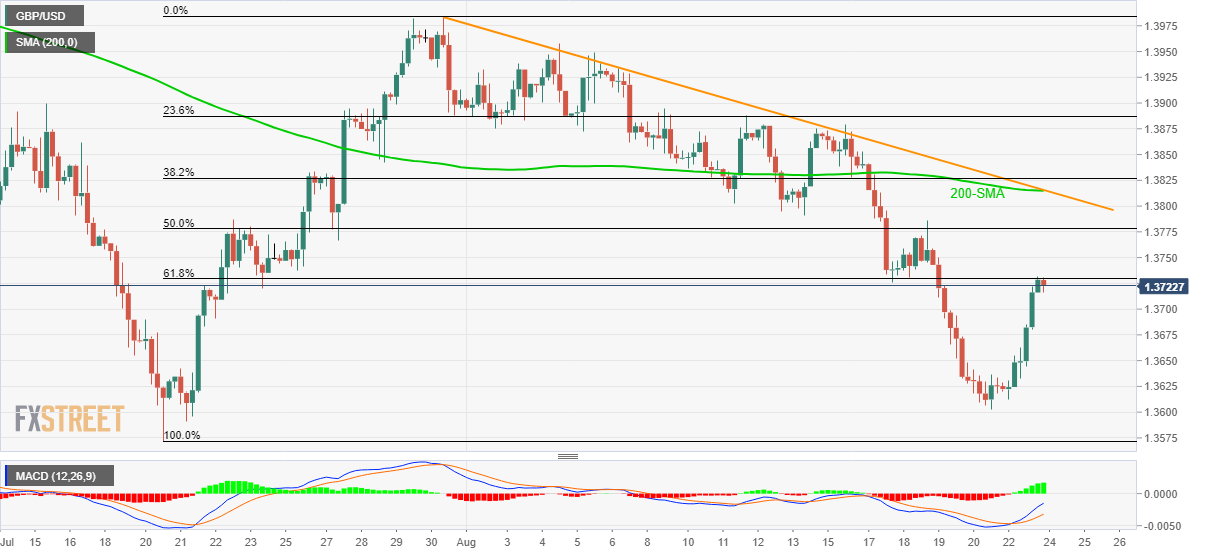
- GBP/USD steps back from 61.8% Fibonacci retracement of late July upside.
- Bullish MACD favors further recovery moves but 200-SMA, monthly resistance line challenge becomes the key hurdle to watch.
GBP/USD bulls take a breather around 1.3720, after the biggest daily jump in six weeks, amid the initial Asia session on Tuesday. In doing so, the cable pair battles a 61.8% Fibonacci retracement level of July 20–30 upside.
Given the bullish MACD signals and the pair’s U-turn from July lows, GBP/USD buyers are likely to overcome the 1.3730 immediate hurdle.
However, the bullish moves may remain less convincing until staying below a convergence of 200-SMA and a descending trend line from July 30, near 1.3815.
It’s worth noting that the 50% Fibonacci retracement level of 1.3778 may entertain GBP/USD buyers past 1.3730.
Meanwhile, pullback moves will have to break the 1.3700 threshold to recall the short-term sellers.
Following that, 1.3630 and the 1.3600 round figure may challenge GBP/USD bears before directing them to the previous month’s low close to 1.3570.
GBP/USD: Four-hour chart
Trend: Further recovery expected
Author

Anil Panchal
FXStreet
Anil Panchal has nearly 15 years of experience in tracking financial markets. With a keen interest in macroeconomics, Anil aptly tracks global news/updates and stays well-informed about the global financial moves and their implications.


