|

GBP/USD Price Analysis: Bulls about to make another move? 1.2450 is key

  • GBP/USD bulls are in the market while above key trendline support.
  • Bears are taking on the micro trendline but 1.2450 is key.

GBP/USD bulls took over on Friday to print a fresh bull cycle high and although we have seen a slide from those highs, so long as the bulls commit to above 1.2450, the bias remains bullish. 

The following is a top-down technical analysis that arrives at a bullish conclusion. 

GBP/USD daily chart

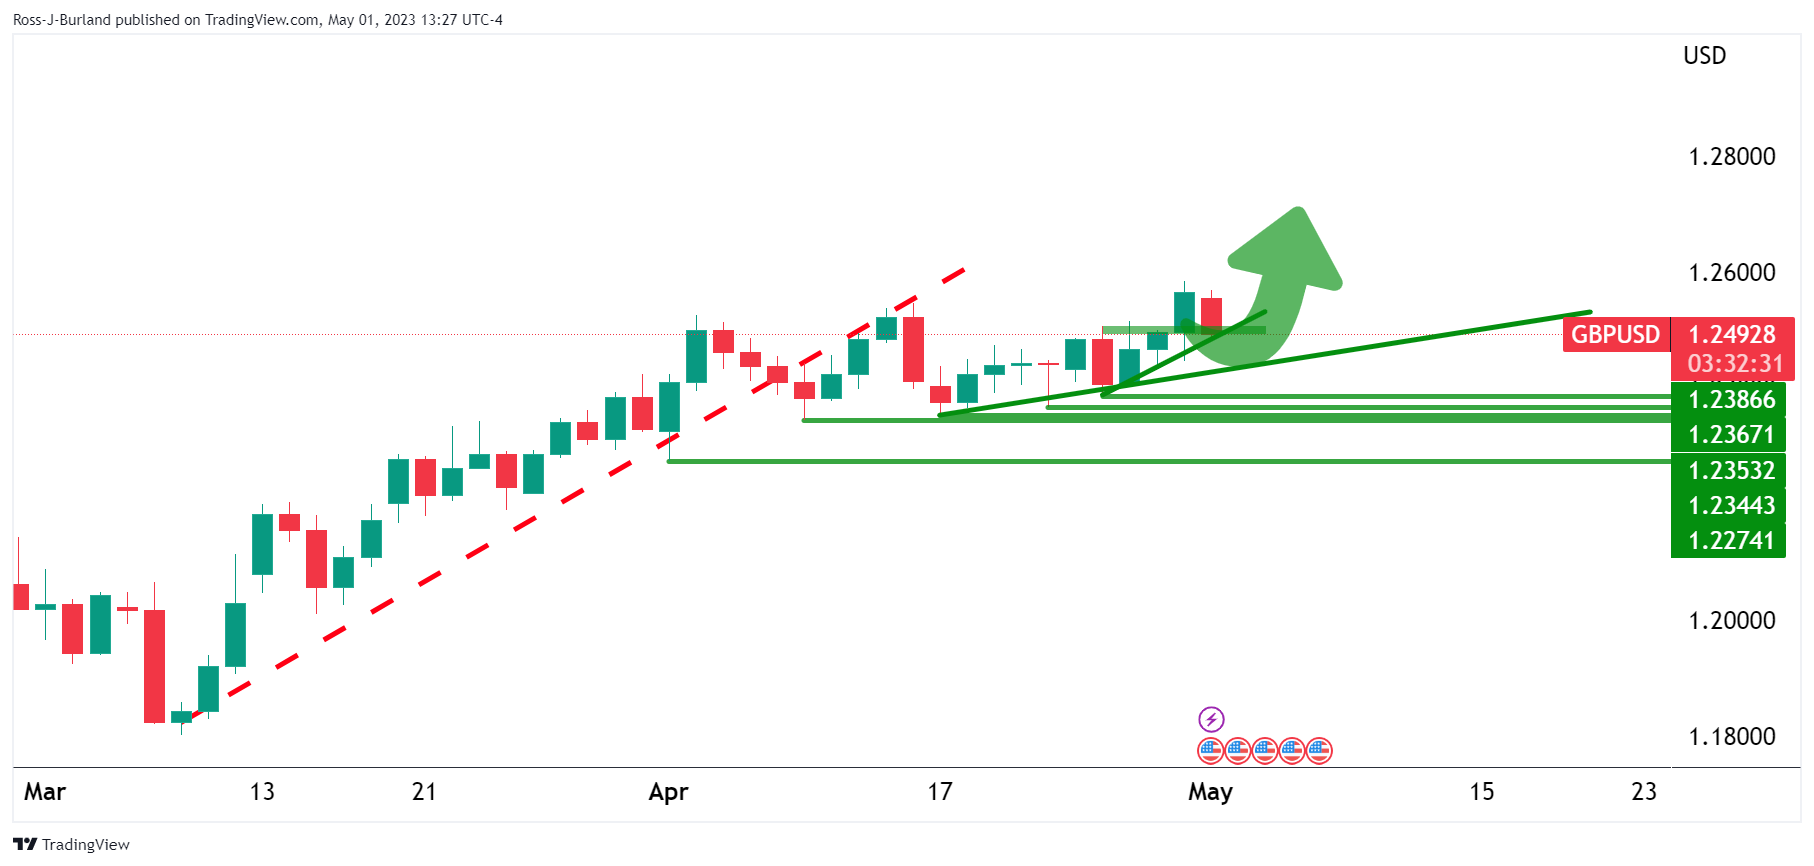
The failed right-hand shoulder of the head and shoulders pattern leaves the bias bullish considering the recent rally that took out the highs of the right-hand shoulder and the head:

GBP/USD H4 charts

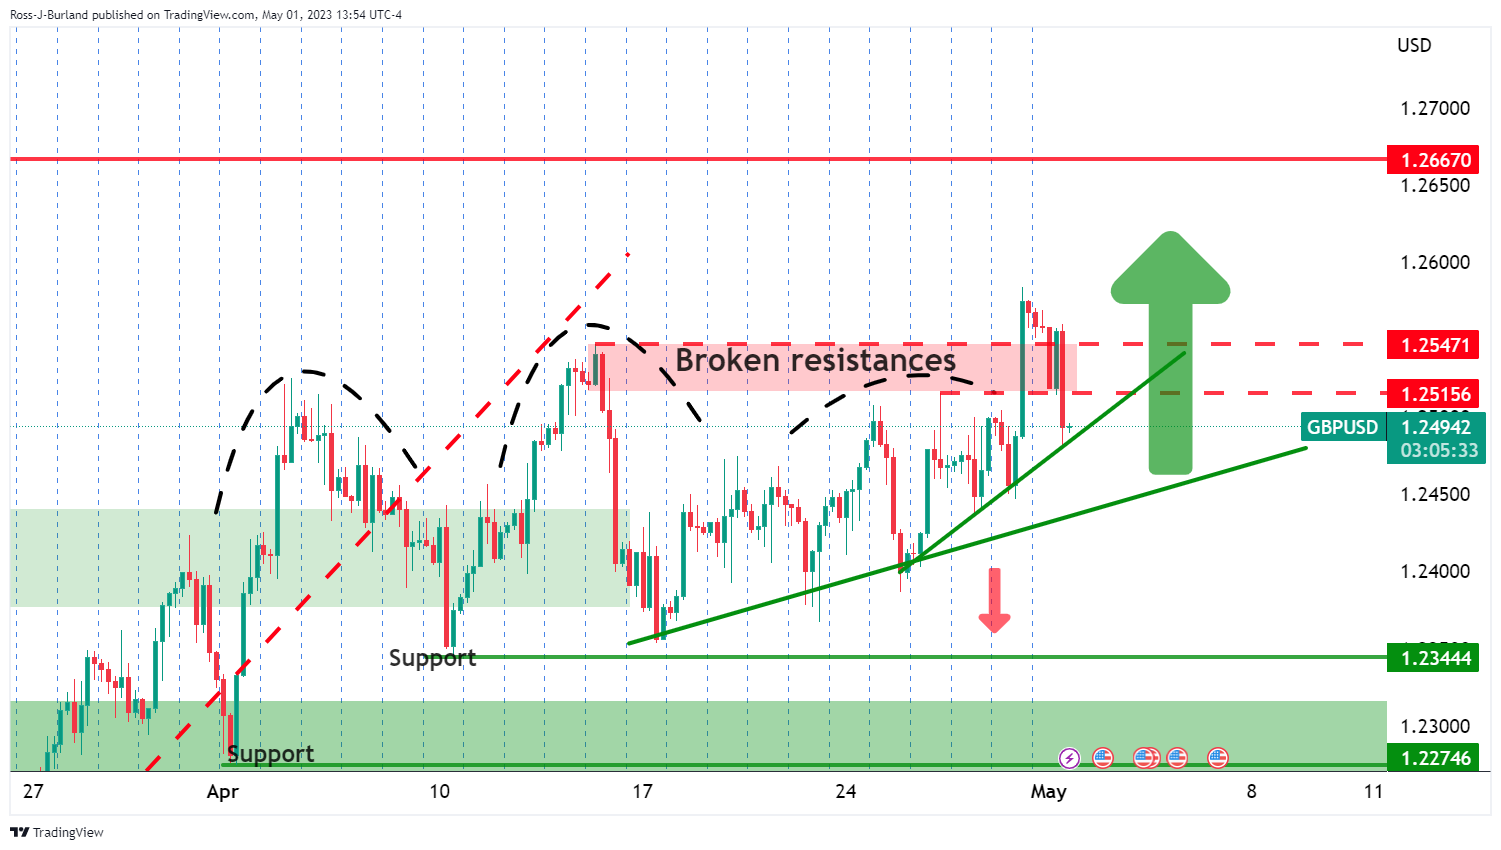
The trendline supports are key in this regard:

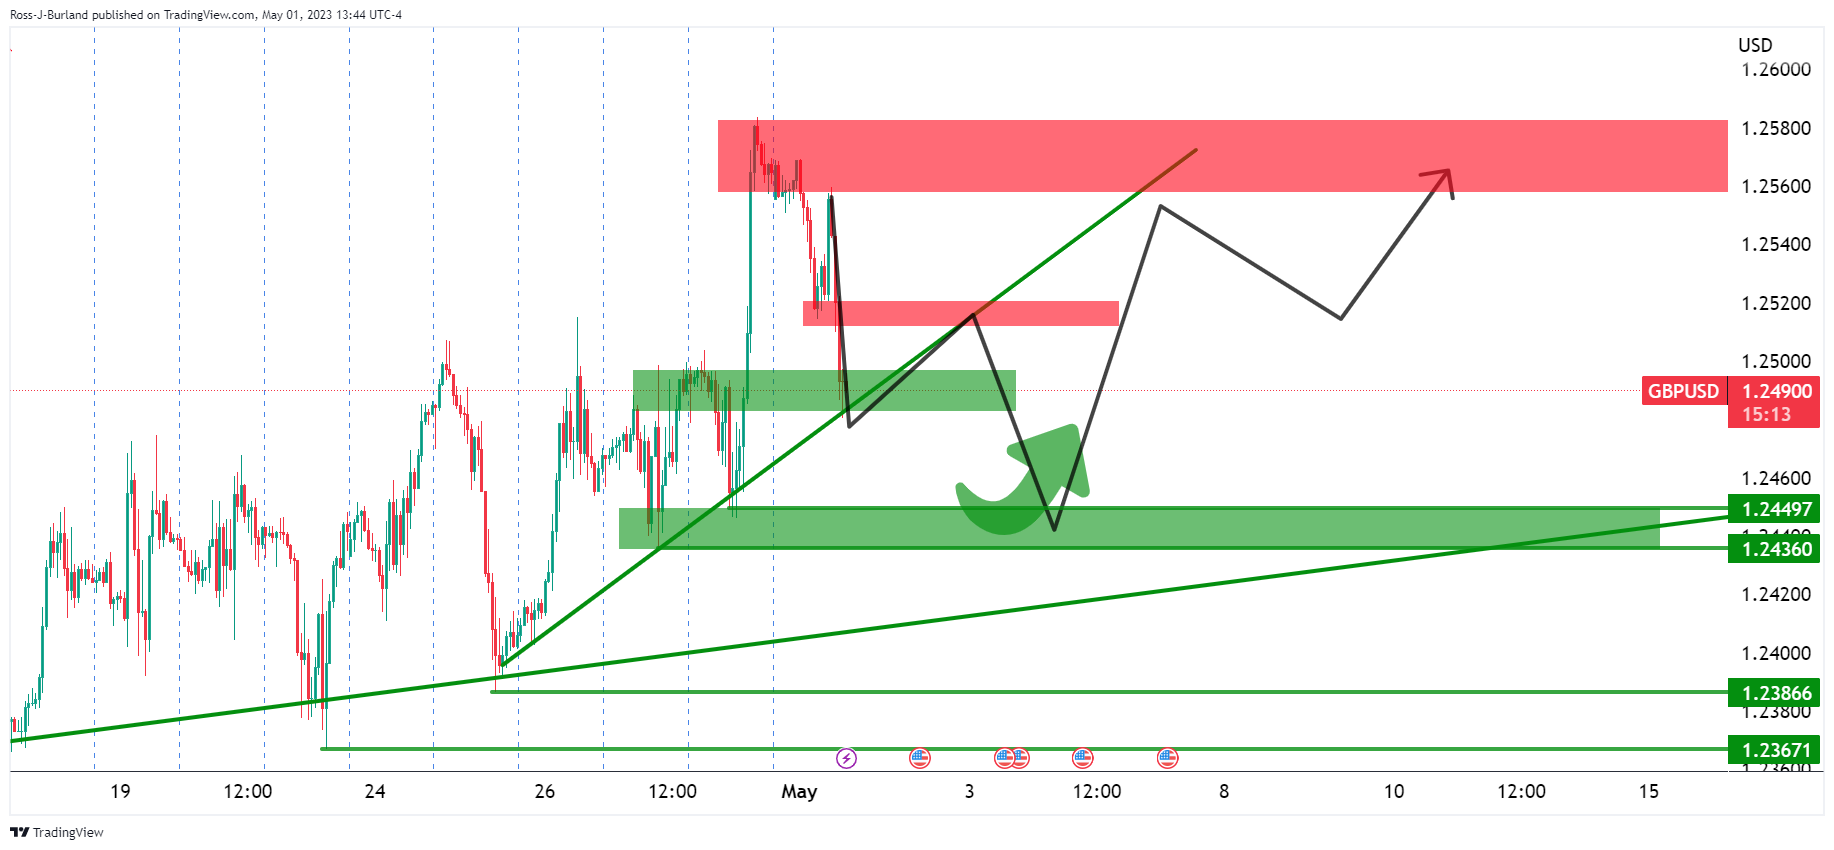
While the above is a theoretical schematic, it identifies the key areas of support and resistances in the 4-hour time frame. The micro trendline is under pressure but so long as the broader trendline remains intact, meeting 1.2450, or thereabouts, then it would be reasonable to expect the bulls to move in again. 

Author

Ross J Burland

Ross J Burland, born in England, UK, is a sportsman at heart. He played Rugby and Judo for his county, Kent and the South East of England Rugby team.

More from Ross J Burland
Share:

Editor's Picks

AUD/USD eyes 0.7150 barrier nine-day EMA

AUD/USD inches higher after registering modest losses in the previous day, trading around 0.7130 during the Asian hours. The technical analysis of the daily chart indicates that the pair is moving sideways within the rectangle pattern, suggesting a consolidation as neither the bulls nor the bears have enough momentum to take control of the market.

USD/JPY trades below 160.00 intervention threshold; bullish bias intact

The USD/JPY pair attracts some sellers during the Asian session amid fears that authorities will step in again to prop up the Japanese Yen. Furthermore, the Israel-Lebanon truce prompts some profit-taking around the US Dollar and exerts downward pressure on the currency pair.

Gold defends 200-day SMA at $4,425, but for how long?

Gold is attempting a tepid recovery toward $4,500 early Thursday, as renewed optimism in the Mideast geopolitical front calms market nerves. This cautious optimism across Asian markets weighs on Oil prices, and diminishes the US Dollar’s safe-haven appeal, helping Gold stage a decent comeback from the weekly low of $4,424.


Hyperliquid: ETF demand, capital rotation fuel HYPE rally as Bitcoin melts

Hyperliquid price sustains an upward trend near its all-time high of $75.76 on Thursday after posting 80% gains in May, while Bitcoin (BTC) retraces below $65,000, triggering a market-wide panic.

Kevin Warsh takes the Fed helm: What it means for the US Dollar
The Federal Reserve moves away from the highly predictable "forward guidance" model of the Jerome Powell era to a new “Kevin Warsh environment”, characterized by less communication, more policy surprises, and an increased focus on the Fed's complex balance sheet.
Recession on paper: What really moves the Canadian Loonie now?

Statistics Canada handed the headline writers a gift and the analysts a headache. Real GDP shrank 0.1% on an annualized basis in the first quarter, and with the fourth quarter of 2025 revised down to a 1.0% contraction, that is two negative quarters in a row, the textbook definition of a technical recession and Canada's first since the pandemic.