|

GBP/USD Price Analysis: Bears stay the course despite break of trendline resistance

GBP/USD is shedding some ground in Asia and is on the back foot in the Tokyo open. The pair has fallen from a high of 1.0992 and has printed a low of 1.0950 so far. Cable has attempted a recovery, scoring a high near 1.1180 on the move out of the prior trendline resistance that now acts as counter-trendline support as illustrated on the hourly charts below:

GBP/USD H1 chart

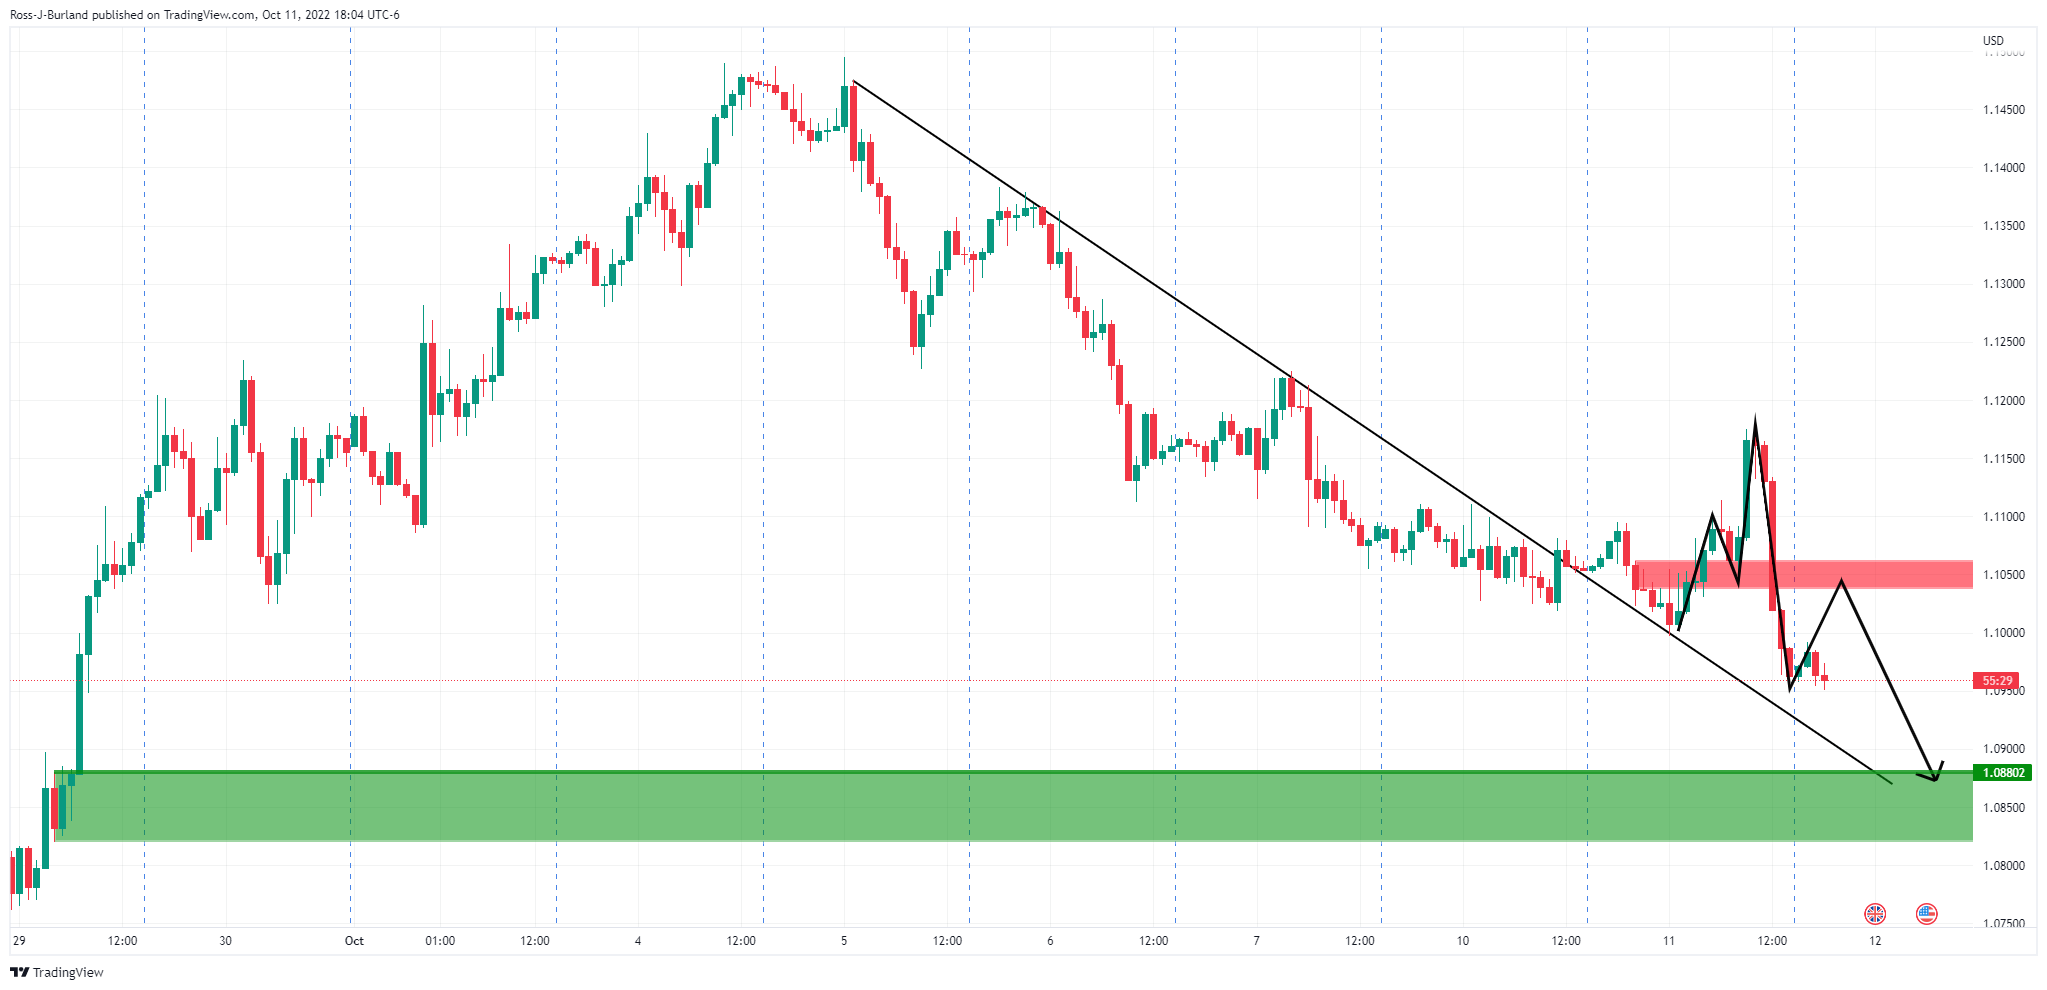
The M-formation is a reversion pattern which is a reversion pattern that might be expected to see the price correct higher in the coming hours, potentially into the neckline that meets a 38.2% Fibonacci retracement level:
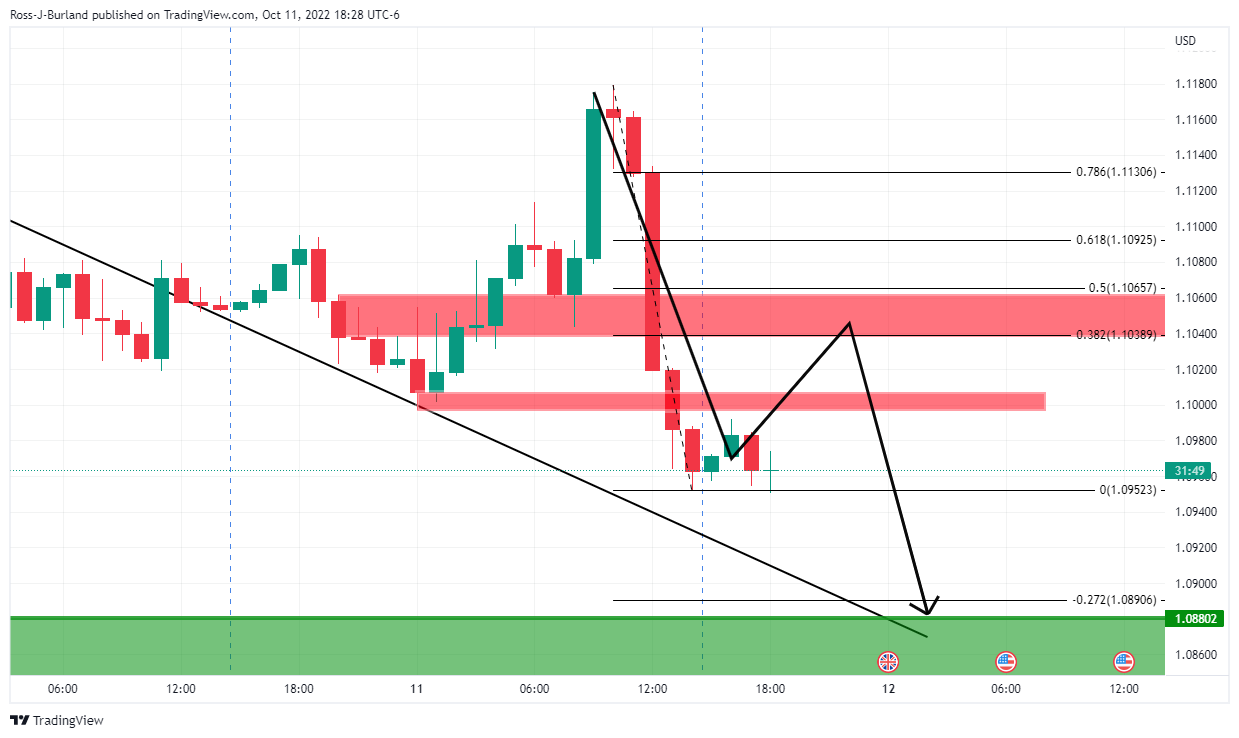
GBP/USD H4 chart

Meanwhile, as for the structure on the four-hour chart, the neckline of the M0formation aligns with prior support dating back to September 30 that reinforces the prospects for there being potential resistance here.

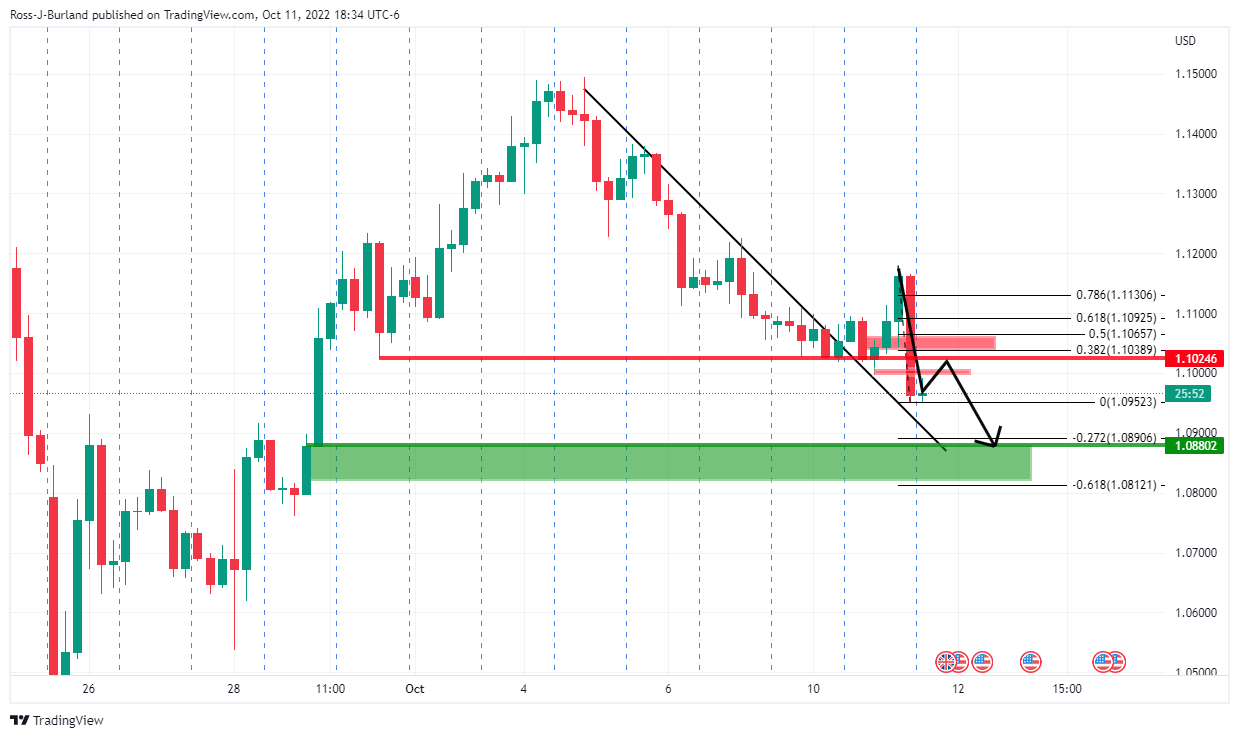
GBP/USD weekly chart

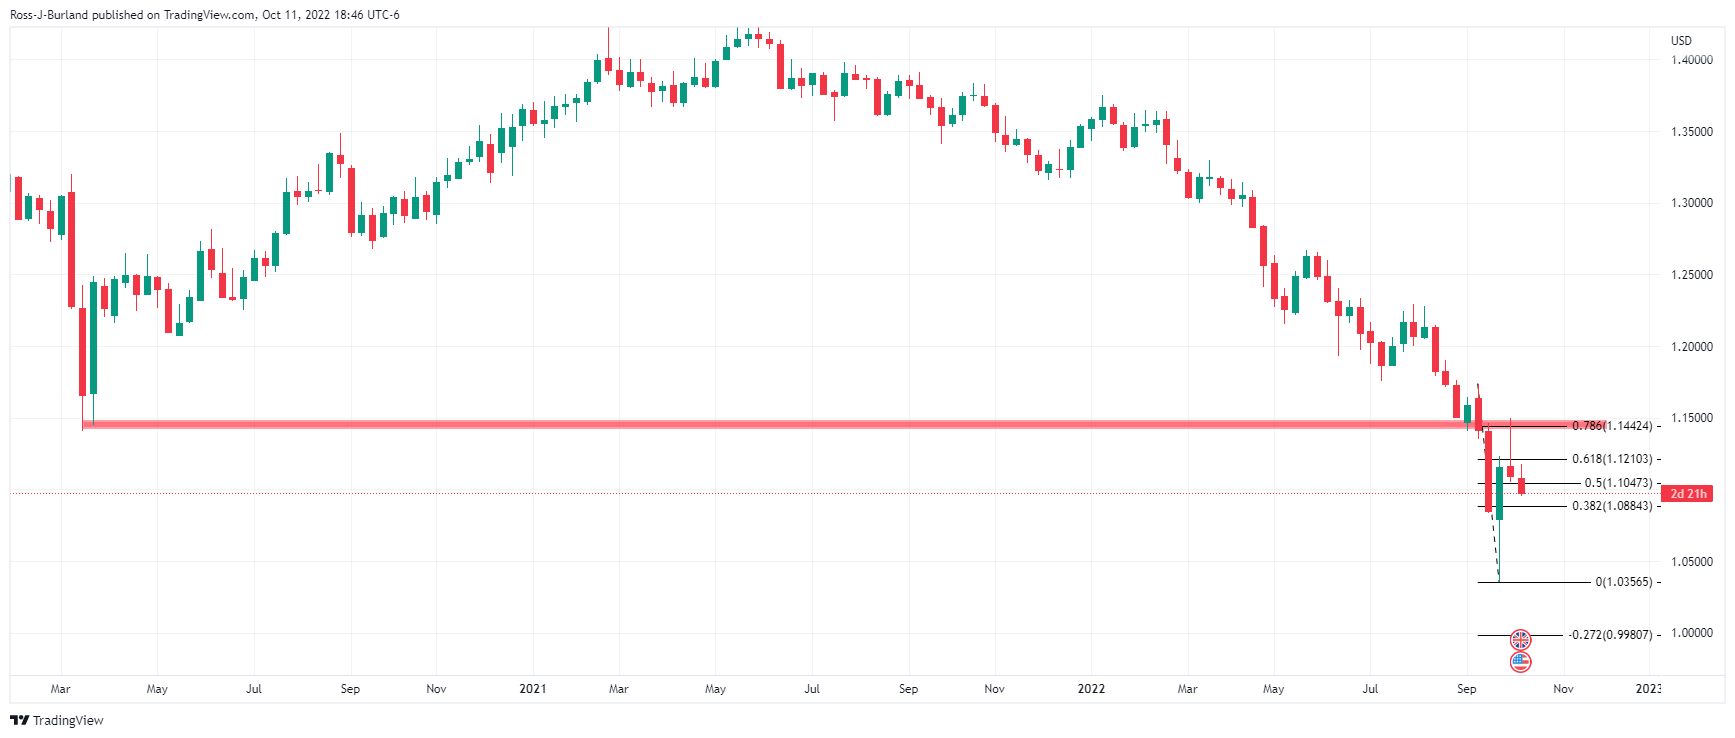
The price remains bearish below 1.1500 following the test of the weekly 78.6% Fibo'.

Author

Ross J Burland

Ross J Burland, born in England, UK, is a sportsman at heart. He played Rugby and Judo for his county, Kent and the South East of England Rugby team.

More from Ross J Burland
Share:

Markets move fast. We move first.

Orange Juice Newsletter brings you expert driven insights - not headlines. Every day on your inbox.

By subscribing you agree to our Terms and conditions.

Editor's Picks

EUR/USD hovers around 1.1700, US Jobless Claims data eyed

EUR/USD is trading in a range around 1.1700 in European trading on Thursday. The pair's upside remains capped by a pause in the US Dollar decline, led by the less hawkish Fed outcome. Markets await the release of the US weekly Initial Jobless Claims report for further trading incentives. 

GBP/USD struggles below 1.3400 ahead of US employment data

GBP/USD stays defensive below 1.3400 in the European session on Thursday, pressured by a modest US Dollar upswing. Nonetheless, the potential downside might be limited after the US Federal Reserve delivered a rate cut at its December policy meeting. Traders brace for the US weekly Initial Jobless Claims report due later in the day. 

Gold bounces off $4,200 neighborhood, down a little amid mixed fundamental cues

Gold recovers slightly from the vicinity of the $4,200 mark, though it sticks to its negative bias through the first half of the European session. The US Dollar attracts some buyers and recovers a part of the previous day's post-FOMC slump to its lowest level since October 24. This fails to assist the commodity in capitalizing on its modest intraday uptick to the weekly high.

Solana dips as hawkish Fed cuts dampen market sentiment

Solana price is trading below $130 on Thursday, after being rejected at the upper boundary of its falling wedge pattern. The broader market weakness following the Federal Reserve’s hawkish rate cut has added to downside momentum.

FOMC Summary: A split cut and a clear shift toward caution

The Federal Reserve (Fed) went ahead with a 25 basis points rate cut, taking the target range to 3.50–3.75%. But the tone around the decision mattered just as much as the move.

Solana dips as hawkish Fed cuts dampen market sentiment
Solana (SOL) price is trading below $130 at the time of writing on Thursday, after being rejected at the upper boundary of its falling wedge pattern. The broader market weakness following the Federal Reserve’s hawkish rate cut has added to downside momentum.