GBP/USD Price Analysis: Bears moving in at a 61.8% Fibo below key resistance
- GBP/USD bears are lurking below key resistance ahead of important US data this week.
- The price is being resisted at a 61.8% Fibonacci correction level.

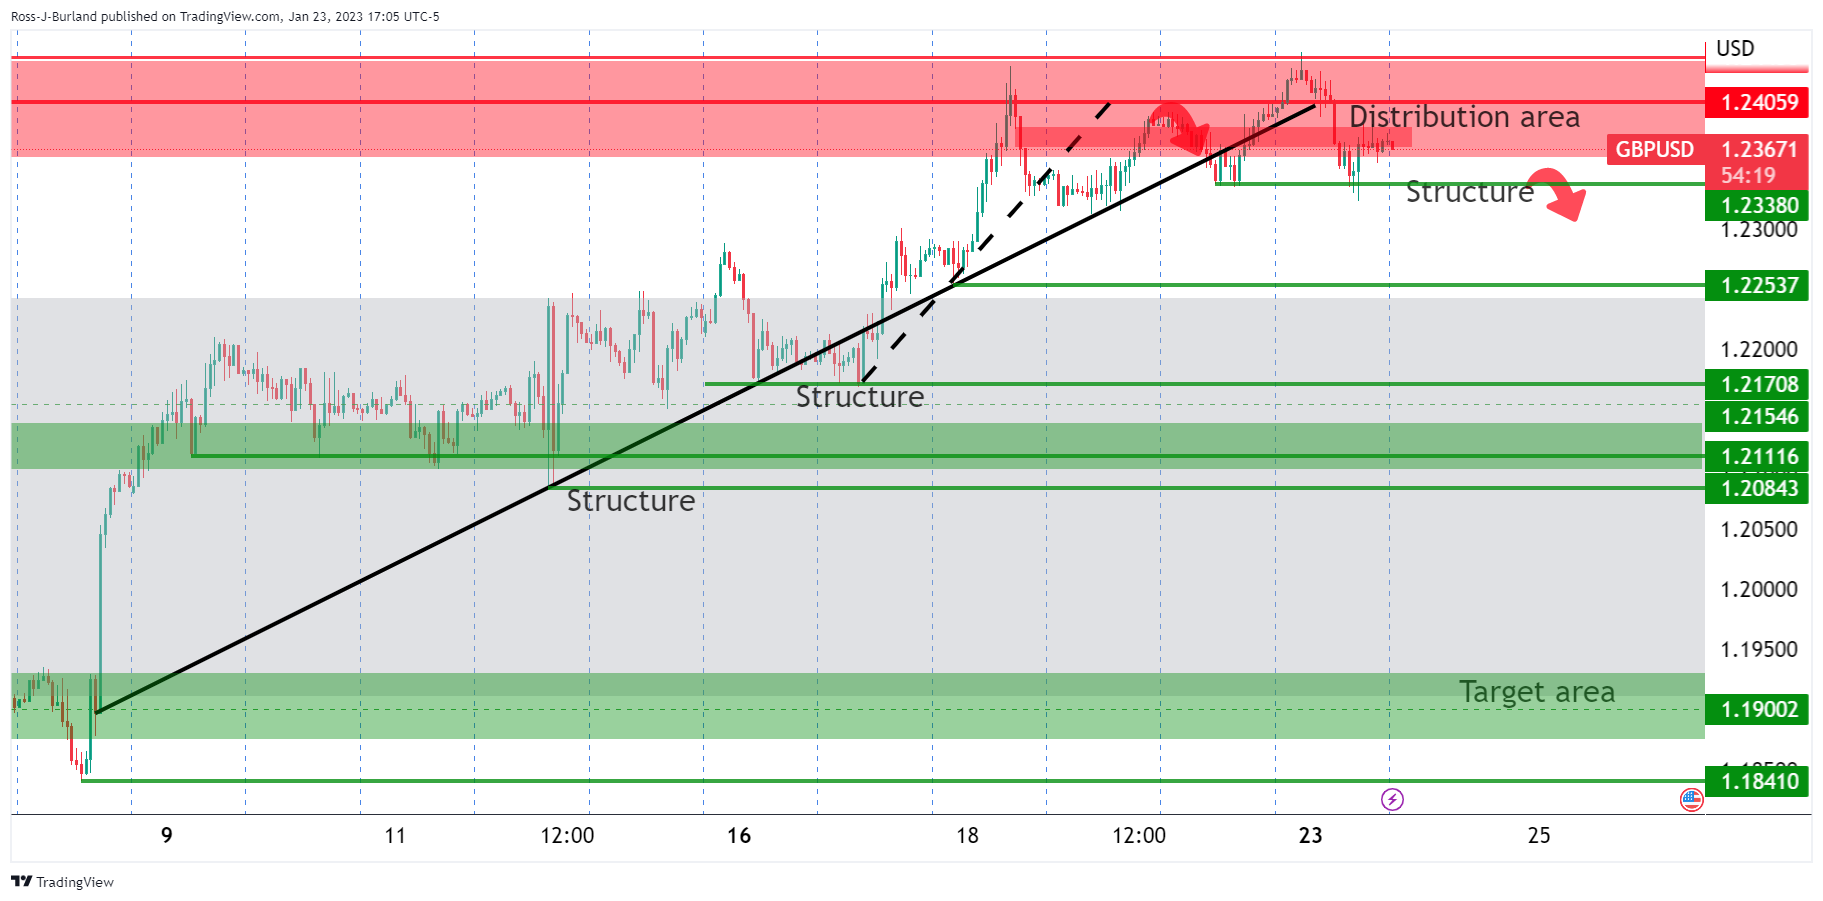
GBP/USD is now teetering on the edge of rolling over following a significant correction from the breakout lows. GBP/USD has been falling out below the structure that was identified in the prior analysis as follows:

The bears were moving in at the end of last week as illustrated on the 4-hour chart above. We have seen a push lower following tests in the 1.24 area that indeed failed.
GBP/USD update
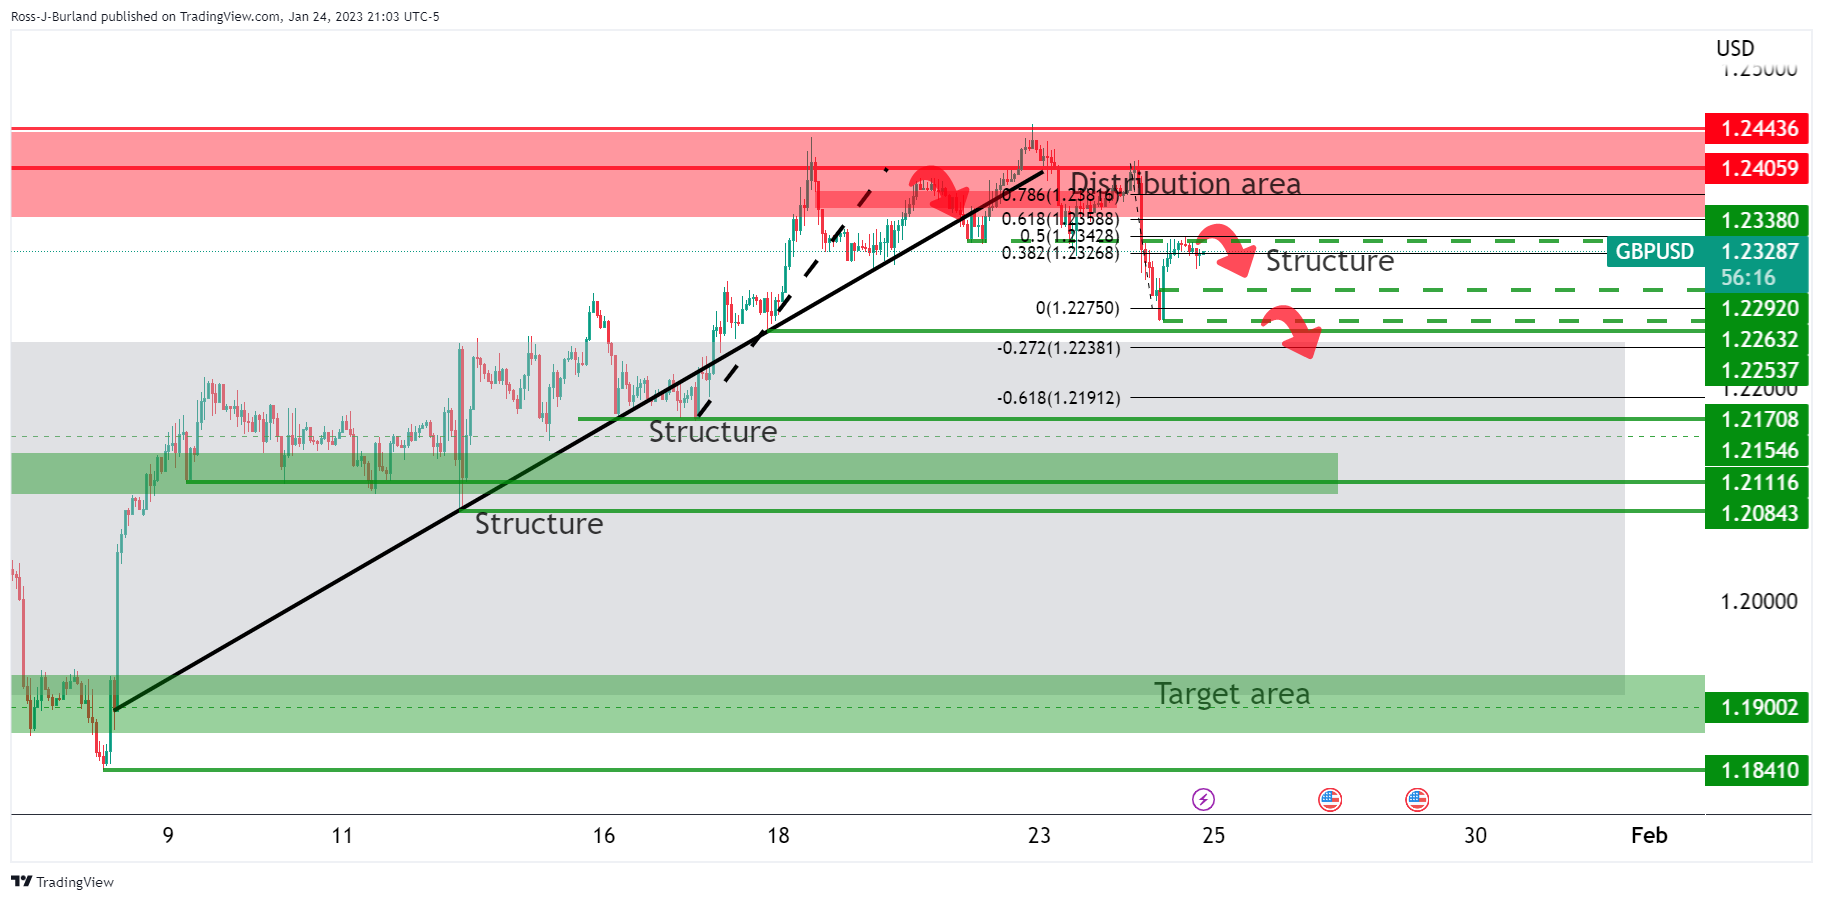
The price is now teetering on the edge of rolling over following a significant correction from the breakout lows. The pair has moved into a 61.8% Fibonacci retracement level and is meeting old support. A break here opens the risk of a strong drop as we progress through the week. However, there is important data on the calendar from the US economy and investors may be sitting on their hands until then.
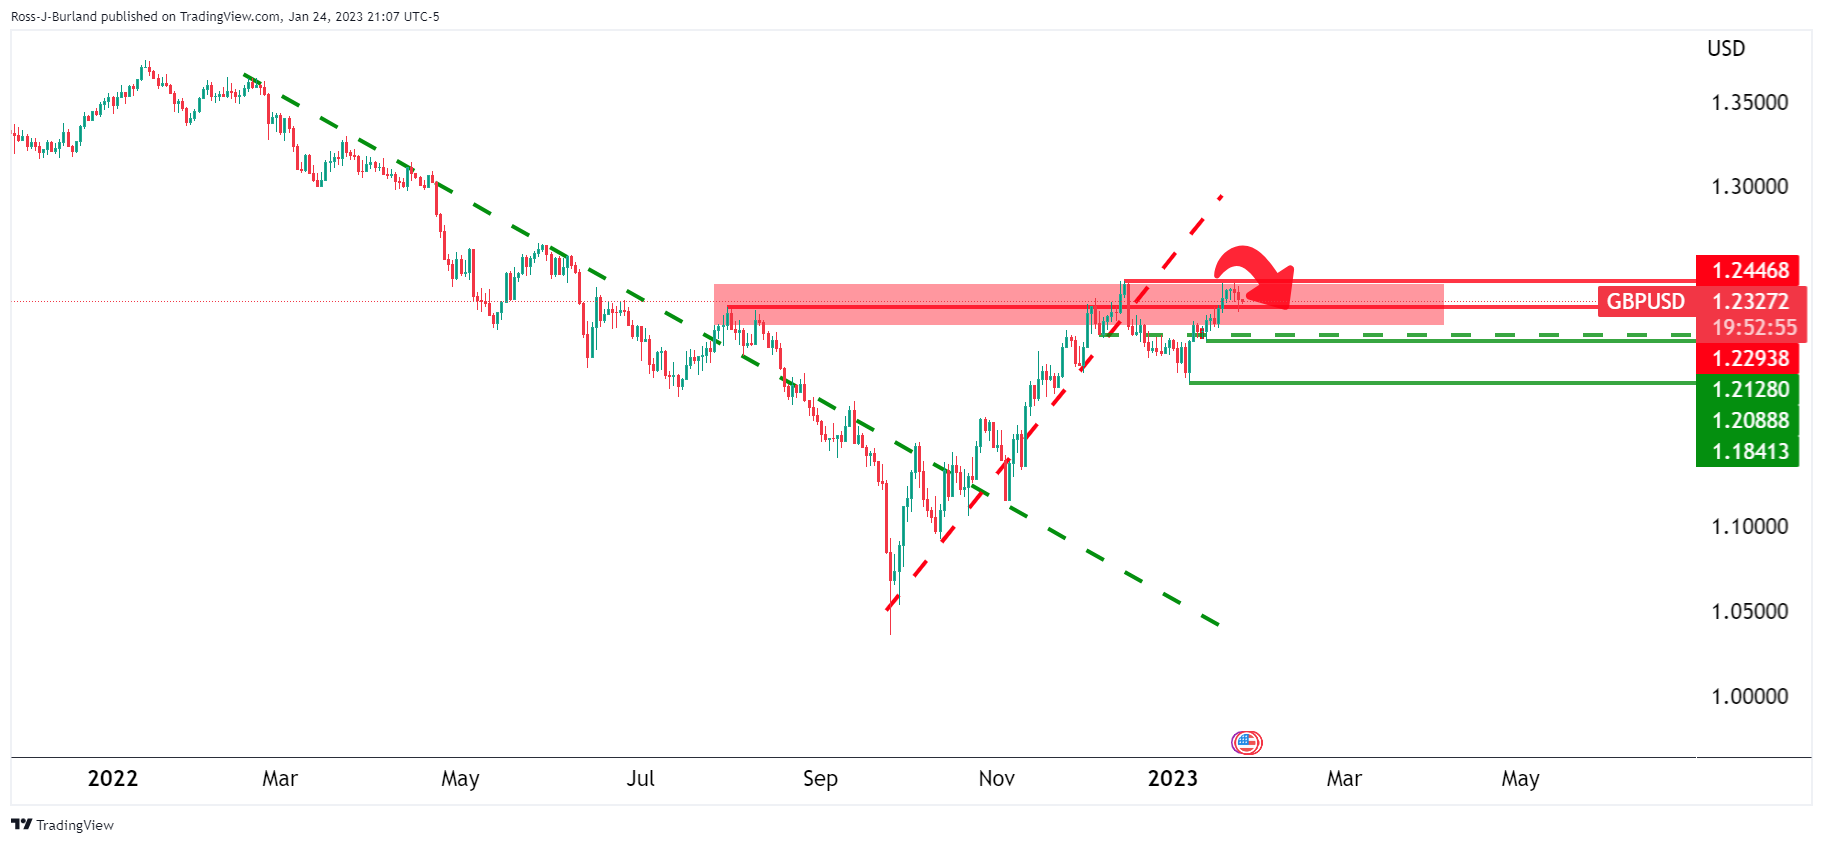
Nevertheless, the daily outlook is bearish all the while the price is below the the1.2450s with 1.2080 eyed on a break below 1.2300.
Author

Ross J Burland
FXStreet
Ross J Burland, born in England, UK, is a sportsman at heart. He played Rugby and Judo for his county, Kent and the South East of England Rugby team.


