|

GBP/USD Price Analysis: Bears keep controls on the way to 1.3935

  • GBP/USD remains pressured around six-week low, stays under the key 1.4010-4000 area.
  • Further losses envisioned on support break, bearish MACD.
  • 100-day SMA offers immediate support ahead of one-year-old rising trend line.

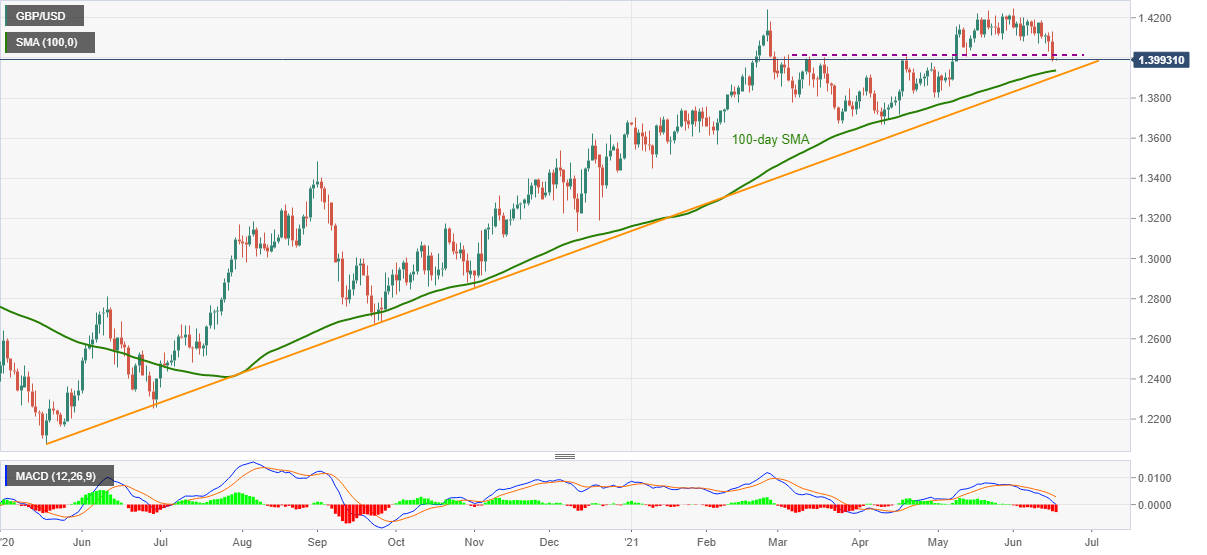
GBP/USD stays depressed around 1.3990 after dropping the most since April-end, not to forget testing early May levels, during the initial Asian session trading on Thursday. The cable pair’s Fed-led slump broke the three-month-old horizontal support around 1.4010-4000. The bearish sentiment also gains support from the downbeat MACD signals.

Read: GBP/USD bears jump on Fed's switch to hawkish on inflation risks, target 1.3980

That said, GBP/USD seller aim for a 100-day SMA level near 1.3935 during the further downside but an ascending support line from May 2020, near 1.3900, could challenge the bears afterward.

In the case where the quote drops below 1.3900, April-end lows near 1.3800 should return to the charts.

Meanwhile, corrective pullback beyond 1.4010 needs to cross the multiple supports, now resistances, marked from late May around 1.4090 to keep the buyers hopeful.

Additionally, the 1.4100 threshold, 1.4185 and the monthly high near 1.4250 could challenge the GBP/USD bulls afterward.

Overall, GBP/USD suggests further downside the break of near-term key support another one on the line may test the bears soon.

GBP/USD daily chart

Trend: Bearish

Additional important levels

Overview
Today last price1.3993
Today Daily Change-89 pips
Today Daily Change %-0.63%
Today daily open1.4082
 
Trends
Daily SMA201.4151
Daily SMA501.401
Daily SMA1001.3932
Daily SMA2001.3582
 
Levels
Previous Daily High1.4129
Previous Daily Low1.4034
Previous Weekly High1.4191
Previous Weekly Low1.4073
Previous Monthly High1.4234
Previous Monthly Low1.3801
Daily Fibonacci 38.2%1.407
Daily Fibonacci 61.8%1.4093
Daily Pivot Point S11.4035
Daily Pivot Point S21.3987
Daily Pivot Point S31.394
Daily Pivot Point R11.4129
Daily Pivot Point R21.4176
Daily Pivot Point R31.4223

Author

Anil Panchal

Anil Panchal

FXStreet

Anil Panchal has nearly 15 years of experience in tracking financial markets. With a keen interest in macroeconomics, Anil aptly tracks global news/updates and stays well-informed about the global financial moves and their implications.

More from Anil Panchal
Share:

Editor's Picks

EUR/USD holds above 1.1750 after mixed EU PMI data

EUR/USD manages to hold above 1.1750 but struggles to gather recovery momentum on Friday, following the mixed February PMI figures from Germany and the Eurozone. In the second half of the day, Q4 GDP, December inflation and February PMI data from the US will be watched closely by market participants.

GBP/USD recovers further toward 1.3500 after UK PMI data

GBP/USD is recovering ground further toward 1.3500 in European trading on Friday, helped by a modest uptick in the Pound Sterling after stronger-than-expected UK January Retail Sales and February PMI data. However, the pair's further upside could be limited amid persistent US Dollar strength as the focus turns to key US data. 

Gold sticks to positive bias above $5,000 ahead of US data

Gold gains some positive traction for the third consecutive day on Friday. holding above $5,000. Traders now look forward to the key US macro releases – the Advance Q4 GDP report and the Personal Consumption Expenditures (PCE) Price Index – for fresh trading impetus. 

US GDP growth expected to slow down significantly in Q4 after stellar Q3 

The United States Bureau of Economic Analysis will publish the first preliminary estimate of the fourth-quarter Gross Domestic Product at 13:30 GMT. Analysts forecast the US economy to have expanded at a 3% annualized rate, slowing down from the 4.4% growth posted in the previous quarter.

Iran tensions and AI fears at the forefront ahead of key US data

Thursday’s scorecard shows major US Stock benchmarks closed modestly in the red amid mounting US-Iran tensions and AI disruption worries. The S&P 500 shed 19 points (0.3%) to 6,861, the Nasdaq 100 lost 101 points (0.4%) to 24,797, and the Dow Jones Industrial Average dropped 267 points (0.5%) to 49,395.

Official Trump price approaches breakout with mixed signals from traders

Official Trump (TRUMP) is trading at $3.50 at the time of writing, approaching its upper consolidation range. A breakout from this range could open the door for an upside move. On-chain data shows market indecision, with balanced flows between bulls and bears, signaling a lack of clear directional bias.