GBP/USD Price Analysis: Bears are moving in with eyes on 1.2350s
- GBP/USD is meeting resistance near 1.2470 and testing trendline support.
- A break below trendline support opens the 1.2350s.

GBP/USD was last trading at 1.2435, up 0.10% on the day, after moving up from a low of 1.2392 to a high of 1.2474 although is running into resistance as the following technical analysis will illustrate. The hawkish sentiment is coming back into the market which is supporting the US Dollar.
Futures pricing shows an 85.7% chance the Fed will hike rates 25 basis points when policymakers conclude a two-day meeting on May 3, although the likelihood of a rate cut by December has narrowed considerably.
GBP/USD daily chart

The resistance is holding up the price near 1.2550 and again at 1.2470 near a 61.8% Fibonacci retracement level.
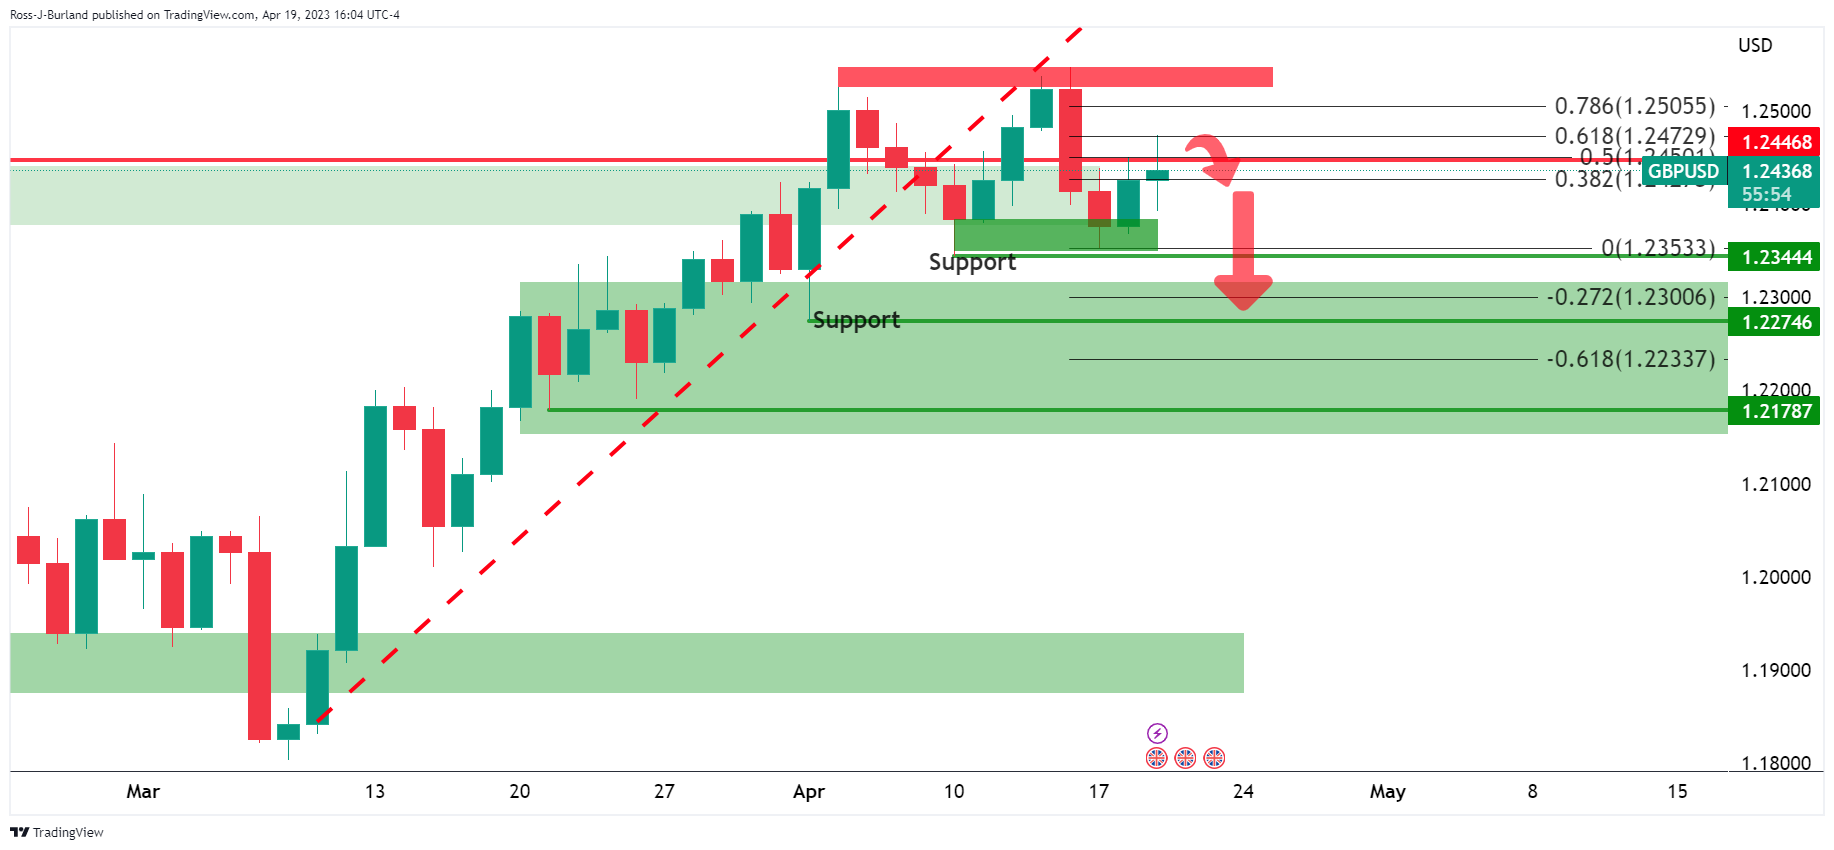
GBP/USD H1 chart

The bears are in the market and are testing the short-term trendline support as illustrated above with eyes on the 1.2350s.
Author

Ross J Burland
FXStreet
Ross J Burland, born in England, UK, is a sportsman at heart. He played Rugby and Judo for his county, Kent and the South East of England Rugby team.


