|

GBP/USD Price Analysis: Aims to revisit two-month highs, hovers above 1.2500

  • GBP/USD moves above the 1.2500 level while recovering recent losses.
  • The pair's bulls could explore the 1.2550 major barrier as technical indicators suggest strong momentum.
  • Seven-day EMA appears as a key support aligned with the 1.2450 major level near to the weekly low.

GBP/USD retraces recent losses registered in the previous session, trading higher around 1.2500 psychological level during the Asian session on Thursday.

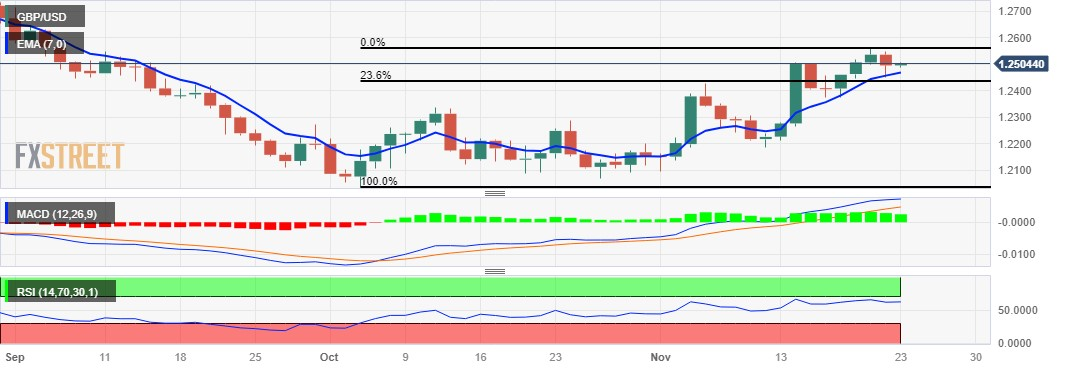
The technical indicators for the GBP/USD pair are signaling a bullish outlook. The 14-day Relative Strength Index (RSI) above the 50 level indicates upward support, suggesting a bullish momentum in favor of the pair.

Additionally, the Moving Average Convergence Divergence (MACD) line, positioned above the centerline and exhibiting divergence above the signal line, implies a strong momentum in the GBP/USD pair.

The GBP/USD could face a challenge around the region at a major level of 1.2550, nearing a two-month high at 1.2559 level. A firm breakthrough above the latter could inspire the bulls of the pair to test the 1.2600 psychological level.

The US Dollar (USD) could improve as investors seem to perceive persistent inflation in the United States (US) following US economic data, which could put pressure on the GBP/USD pair. The seven-day Exponential Moving Average (EMA) at 1.2469 could act as a key support aligned with the 1.2450 major level and the weekly low at 1.2446.

A decisive break below the support region could push the GBP/USD pair to navigate the next support area around the 23.6% Fibonacci retracement at 1.2436 followed by the 1.2400 psychological level.

GBP/USD: Daily Chart
GBP/USD: more technical levels

Overview
Today last price1.2509
Today Daily Change0.0013
Today Daily Change %0.10
Today daily open1.2496
 
Trends
Daily SMA201.2313
Daily SMA501.2257
Daily SMA1001.2503
Daily SMA2001.245
 
Levels
Previous Daily High1.255
Previous Daily Low1.2449
Previous Weekly High1.2506
Previous Weekly Low1.2213
Previous Monthly High1.2337
Previous Monthly Low1.2037
Daily Fibonacci 38.2%1.2488
Daily Fibonacci 61.8%1.2511
Daily Pivot Point S11.2447
Daily Pivot Point S21.2398
Daily Pivot Point S31.2346
Daily Pivot Point R11.2547
Daily Pivot Point R21.2598
Daily Pivot Point R31.2647

Author

Akhtar Faruqui

Akhtar Faruqui is a Forex Analyst based in New Delhi, India. With a keen eye for market trends and a passion for dissecting complex financial dynamics, he is dedicated to delivering accurate and insightful Forex news and analysis.


More from Akhtar Faruqui
Share:

Editor's Picks

GBP/USD holds recovery gains near 1.3400 despite soft UK CPI data

GBP/USD clings to recovery gains near 1.3400 in European trading on Wednesday. The UK annual Consumer Price Index (CPI) inflation cooled to 2.6% in June against the market forecast of 2.7%, failing to deter the British Pound's rebound from weekly troughs. However, the pair's further upside could be limited by ongoing Mideast tensions and sustained US Dollar demand as a haven.

EUR/USD gains ground above 1.1400 on hawkish ECB tone

The EUR/USD pair holds positive ground near 1.1410 during the early European trading hours, bolstered by a hawkish tone from the European Central Bank. However, the potential upside for the major pair might be limited amid escalating military tensions and recent retaliatory airstrikes between the US and Iran.

Gold ease from two-week top as energy-driven inflation fears bolster Fed hike bets

Gold retreats slightly from a two-week high touched earlier this Wednesday, albeit it retains an intraday bullish bias through the first half of the European session. Hopes that US-Iran diplomacy could ease energy prices and temper hawkish US Federal Reserve expectations undermine the US Dollar, which is seen supporting the commodity. In fact, top negotiators for Iran and the US signaled that they have not walked away from talks.

Cardano: Short-term recovery lacks retail support

Cardano price edges lower after the 50-day Exponential Moving Average at $1.770 capped two consecutive days of recovery seen earlier this week. ADA futures point to waning retail traction as Open Interest and trading volume decline amid elevated long liquidations. The technical outlook for ADA is bearish, as momentum remains subdued below a resistance trendline near $0.1782.

Chip stocks are more volatile than Oil

I continue to start the day by looking at these two charts: US crude & Kospi. The former is extending gains, trading above $86 per barrel for WTI and $92 per barrel for Brent, while the Kospi is up more than 4.5%, led higher by Korean chipmakers following a similar jump in VanEck's Semiconductor ETF yesterday.

US Dollar mid-year outlook: Exceptional currency, exceptional risks?
The US Dollar enters the second half of 2026 in a markedly different position from a year ago. The King currency has recovered, reflecting persistent US inflation, changing expectations for Fed policy, geopolitical tensions and renewed demand for defensive assets.














