GBP/USD plunges into new lows as losses accelerate
- GBP/USD tumbled below 1.3100 on Tuesday, making a clean downside break.
- Bearish pressure is mounting as Cable traders jump ship ahead of the BoE’s latest interest rate decision.
- Market sentiment is drawing safe-haven flows back into the US Dollar, pummeling the Pound Sterling.

GBP/USD fell further on Tuesday, making a clean downside break of the 1.3100 handle and shedding around 0.9% over a single day as Cable losses continue to pile on. The Pound Sterling (GBP) has closed flat or down against the US Dollar (USD) for all but two of the last 12 consecutive trading sessions as GBP/USD races toward a third straight week of one-sided declines.
Little of note lies on the UK side of this week’s data docket until the BoE’s upcoming interest rate decision on Thursday. Even here, little change is expected. The Monetary Policy Committee (MPC) is expected to vote six-to-three to keep interest rates unchanged. The addition of another rate cut vote will be of some note for particularly attentive central bank policy wonks; however, meaningful changes in the BoE’s interest rate stance are unlikely to materialize with the UK’s headline inflation rate standing at 3.8% as of August, nearly double the BoE’s preferred 2% target band.
US ADP Employment Change figures for October are due on Wednesday. ADP numbers have a historically disastrous correlation to actual official datasets from one release to the next, but that is unlikely to stop investors from placing additional importance on the volatile month-to-month ADP figure while the ongoing US government shutdown shuts off the flow of more meaningful sample estimates such as the Nonfarm Payrolls (NFP) jobs report.
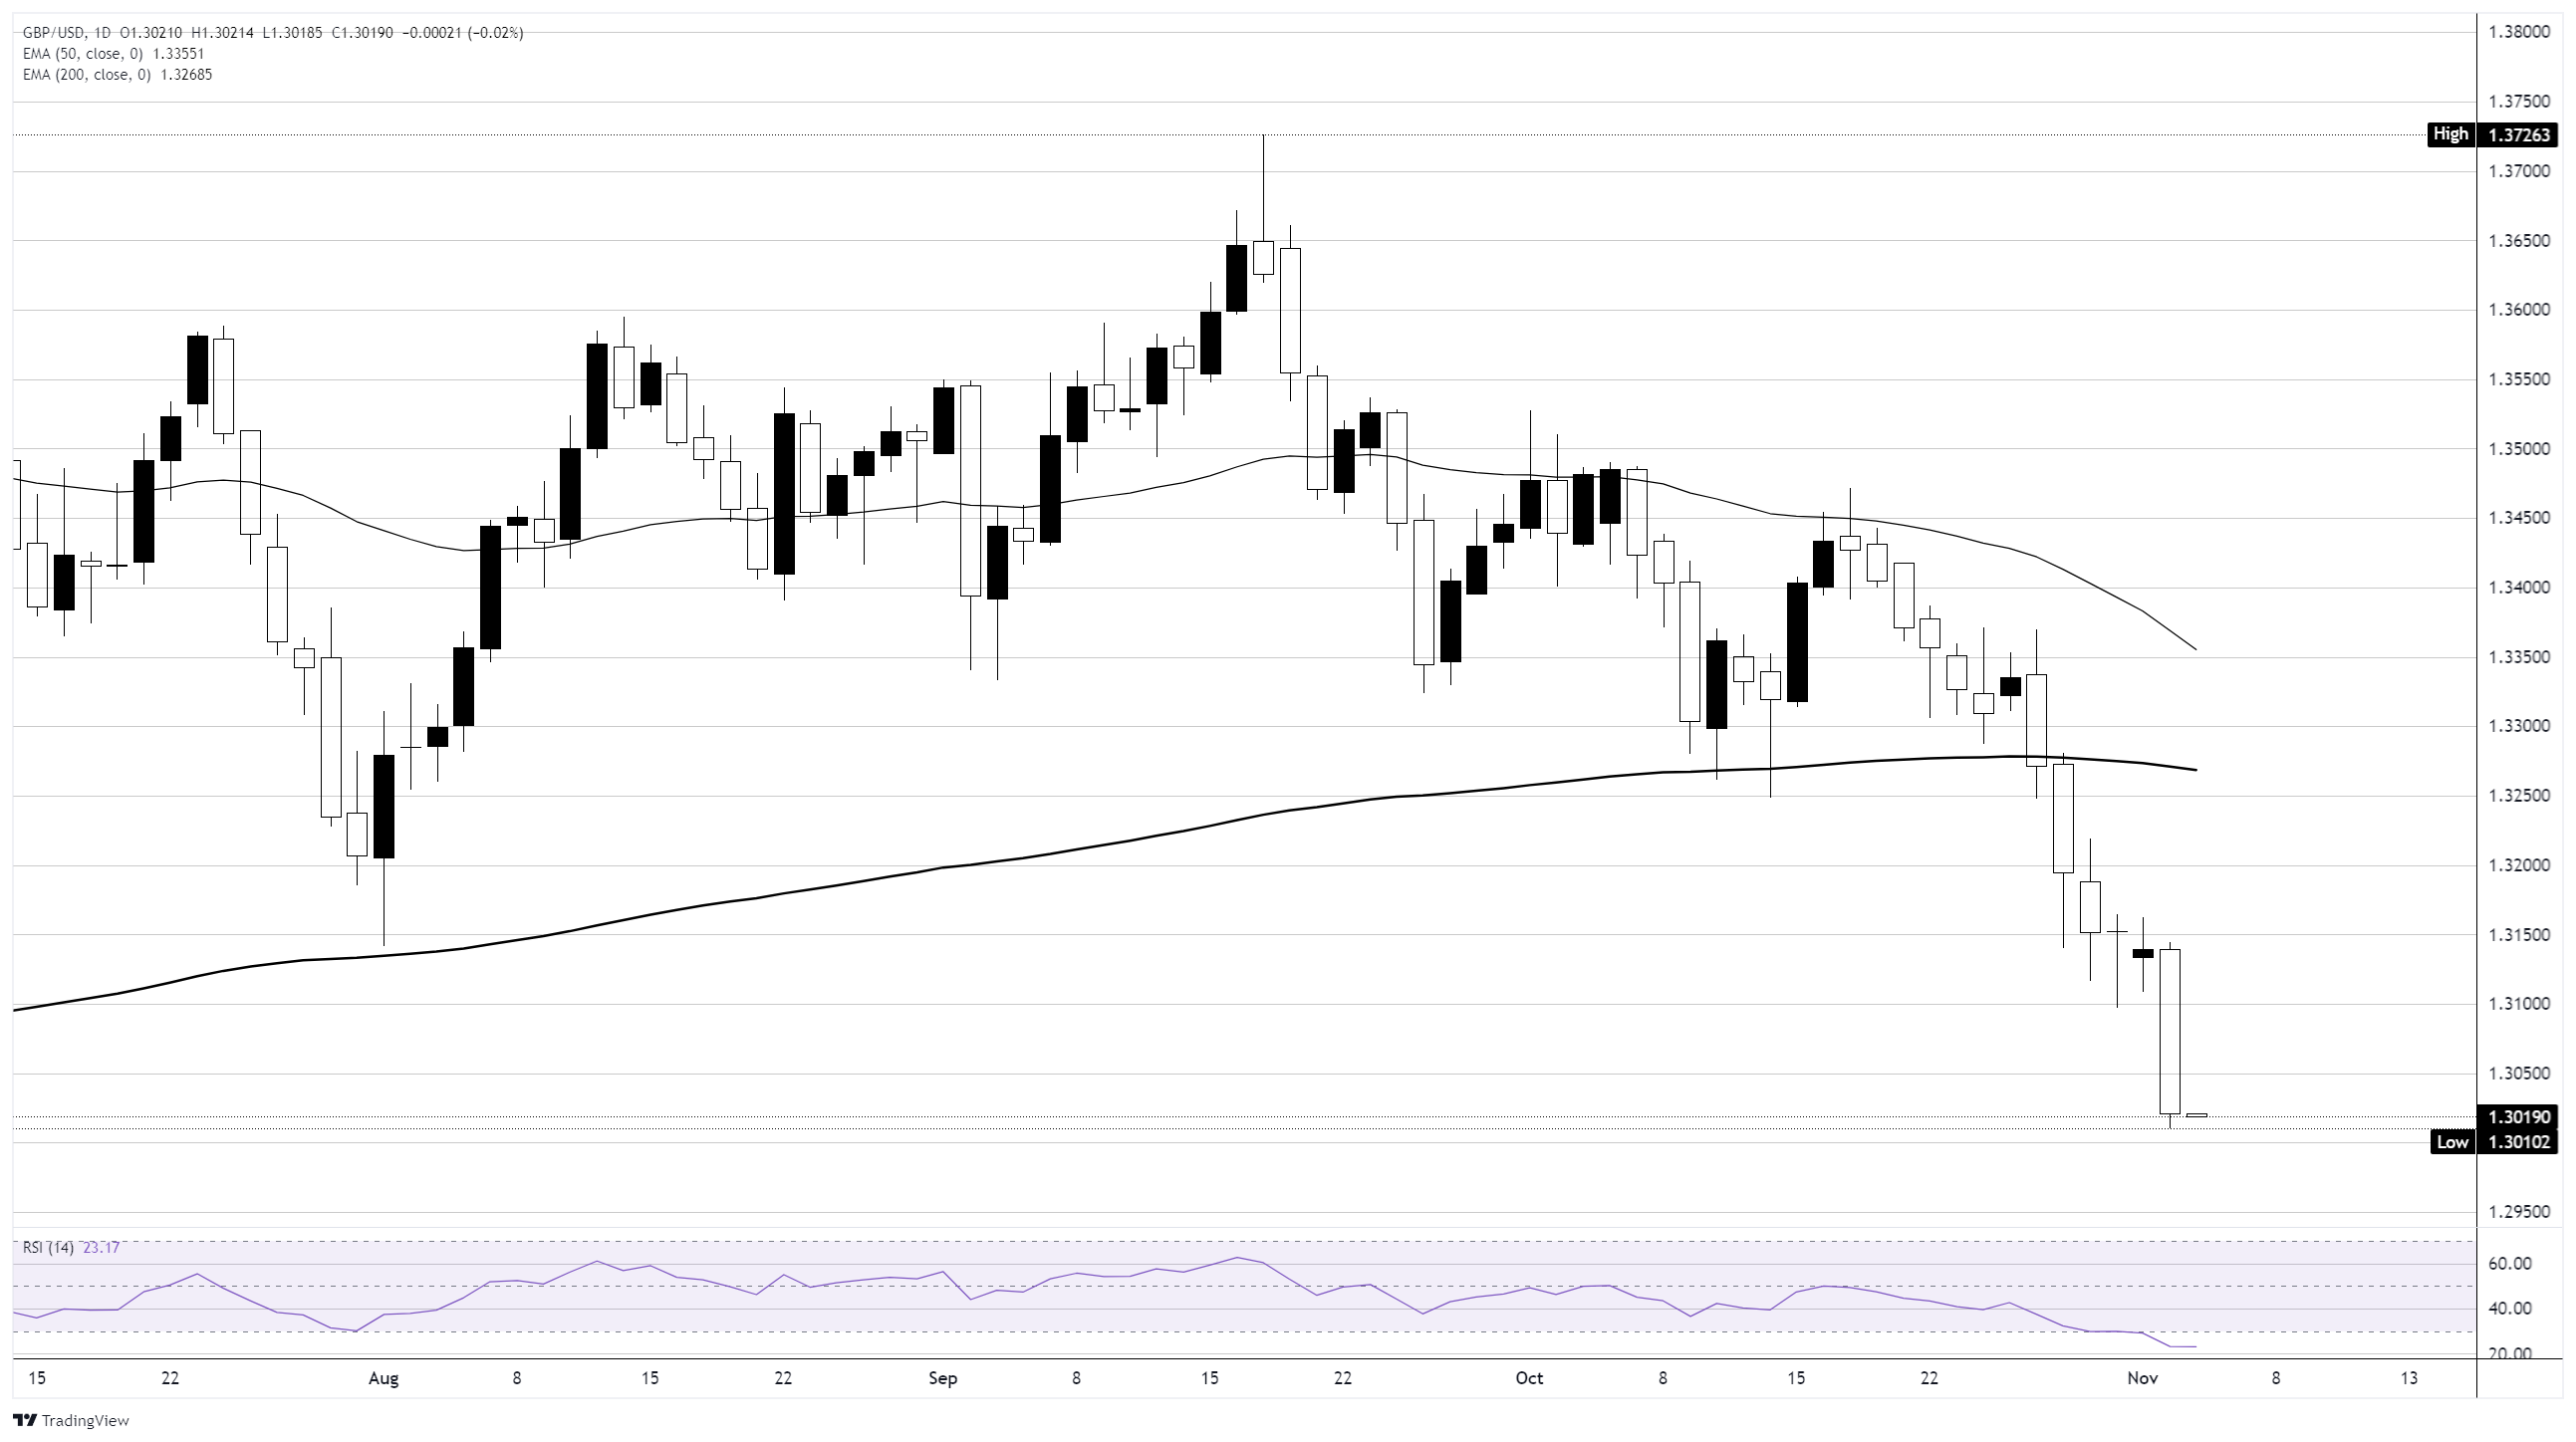
GBP/USD daily chart
Pound Sterling FAQs
The Pound Sterling (GBP) is the oldest currency in the world (886 AD) and the official currency of the United Kingdom. It is the fourth most traded unit for foreign exchange (FX) in the world, accounting for 12% of all transactions, averaging $630 billion a day, according to 2022 data. Its key trading pairs are GBP/USD, also known as ‘Cable’, which accounts for 11% of FX, GBP/JPY, or the ‘Dragon’ as it is known by traders (3%), and EUR/GBP (2%). The Pound Sterling is issued by the Bank of England (BoE).
The single most important factor influencing the value of the Pound Sterling is monetary policy decided by the Bank of England. The BoE bases its decisions on whether it has achieved its primary goal of “price stability” – a steady inflation rate of around 2%. Its primary tool for achieving this is the adjustment of interest rates. When inflation is too high, the BoE will try to rein it in by raising interest rates, making it more expensive for people and businesses to access credit. This is generally positive for GBP, as higher interest rates make the UK a more attractive place for global investors to park their money. When inflation falls too low it is a sign economic growth is slowing. In this scenario, the BoE will consider lowering interest rates to cheapen credit so businesses will borrow more to invest in growth-generating projects.
Data releases gauge the health of the economy and can impact the value of the Pound Sterling. Indicators such as GDP, Manufacturing and Services PMIs, and employment can all influence the direction of the GBP. A strong economy is good for Sterling. Not only does it attract more foreign investment but it may encourage the BoE to put up interest rates, which will directly strengthen GBP. Otherwise, if economic data is weak, the Pound Sterling is likely to fall.
Another significant data release for the Pound Sterling is the Trade Balance. This indicator measures the difference between what a country earns from its exports and what it spends on imports over a given period. If a country produces highly sought-after exports, its currency will benefit purely from the extra demand created from foreign buyers seeking to purchase these goods. Therefore, a positive net Trade Balance strengthens a currency and vice versa for a negative balance.
Author

Joshua Gibson
FXStreet
Joshua joins the FXStreet team as an Economics and Finance double major from Vancouver Island University with twelve years' experience as an independent trader focusing on technical analysis.


