GBP/USD pinned to key technical levels ahead of Friday’s US inflation update
- GBP/USD is mired in long-term averages near 1.2620.
- Mixed US data on Thursday left risk appetite in the lurch.
- US PCE Price Index inflation to round out the week’s data releases.

GBP/USD waffled on Thursday, churning in empty yet familiar chart paper between long-term moving averages, with price action sandwiched between the 1.2700 and 1.2600 handles. US data came in mixed, leaving market sentiment to grind into the middle as investors await Friday’s key US inflation print.
Forex Today: US inflation comes to the fore... again
Before key US price growth data, the upcoming US Presidential Election is expected in the early Friday market session. Investors will be keeping one ear out for any hints regarding potential policy plans from all of the US candidates.
During the London market window, the UK also drops revisions to first-quarter Gross Domestic Product (GDP). Median market forecasts expect UK GDP growth to hold steady at the initial print of 0.6% QoQ.
US Initial Jobless Claims for the week ended Jun 21 came in better than expected, showing 233K net new jobless benefits seekers compared to the forecast 236K, and down slightly further from the previous week’s 238K. The four-week average for Initial Jobless Claims jumped to 236K, bringing the newest week-on-week figure back below the running average.
US Gross Domestic Product (GDP) met expectations on Thursday, with Q1 GDP slightly revised to 1.4% from the initial print of 1.3%. Core Personal Consumption Expenditures in the first quarter also rose slightly, ticking up to 3.7% QoQ versus the forecast hold at 3.6%. Thursday’s upcoming Presidential debate, due to start after the day’s market close, will draw some attention as investors keep an eye out for possible policy hints from candidates.
Friday’s US PCE Price Index inflation print will be the week’s key data figure as investors hope for continued cooling in US inflation numbers to help push the Federal Reserve (Fed) closer toward rate cuts. At current cut, core PCE Price Index inflation is forecast to tick down to 0.1% MoM in May from 0.2%.
Economic Indicator
Core Personal Consumption Expenditures - Price Index (MoM)
The Core Personal Consumption Expenditures (PCE), released by the US Bureau of Economic Analysis on a monthly basis, measures the changes in the prices of goods and services purchased by consumers in the United States (US). The PCE Price Index is also the Federal Reserve’s (Fed) preferred gauge of inflation. The MoM figure compares the prices of goods in the reference month to the previous month.The core reading excludes the so-called more volatile food and energy components to give a more accurate measurement of price pressures. Generally, a high reading is bullish for the US Dollar (USD), while a low reading is bearish.
Read more.Next release: Fri Jun 28, 2024 12:30
Frequency: Monthly
Consensus: 0.1%
Previous: 0.2%
Source: US Bureau of Economic Analysis
After publishing the GDP report, the US Bureau of Economic Analysis releases the Personal Consumption Expenditures (PCE) Price Index data alongside the monthly changes in Personal Spending and Personal Income. FOMC policymakers use the annual Core PCE Price Index, which excludes volatile food and energy prices, as their primary gauge of inflation. A stronger-than-expected reading could help the USD outperform its rivals as it would hint at a possible hawkish shift in the Fed’s forward guidance and vice versa.
GBP/USD technical outlook
The Cable has ground to a halt at the 200-day Exponential Moving Average (EMA) near 1.2611, with the pair hamstrung between 1.2700 and 1.2600, and Thursday’s price action caught between the 200-day and 50-day EMAs.
Downside pressure is more apparent on intraday charts, with a clear low-side drift baked into hourly candlesticks as buyers remain unable to push intraday price action back above the 200-hour EMA at 1.2674.
GBP/USD hourly chart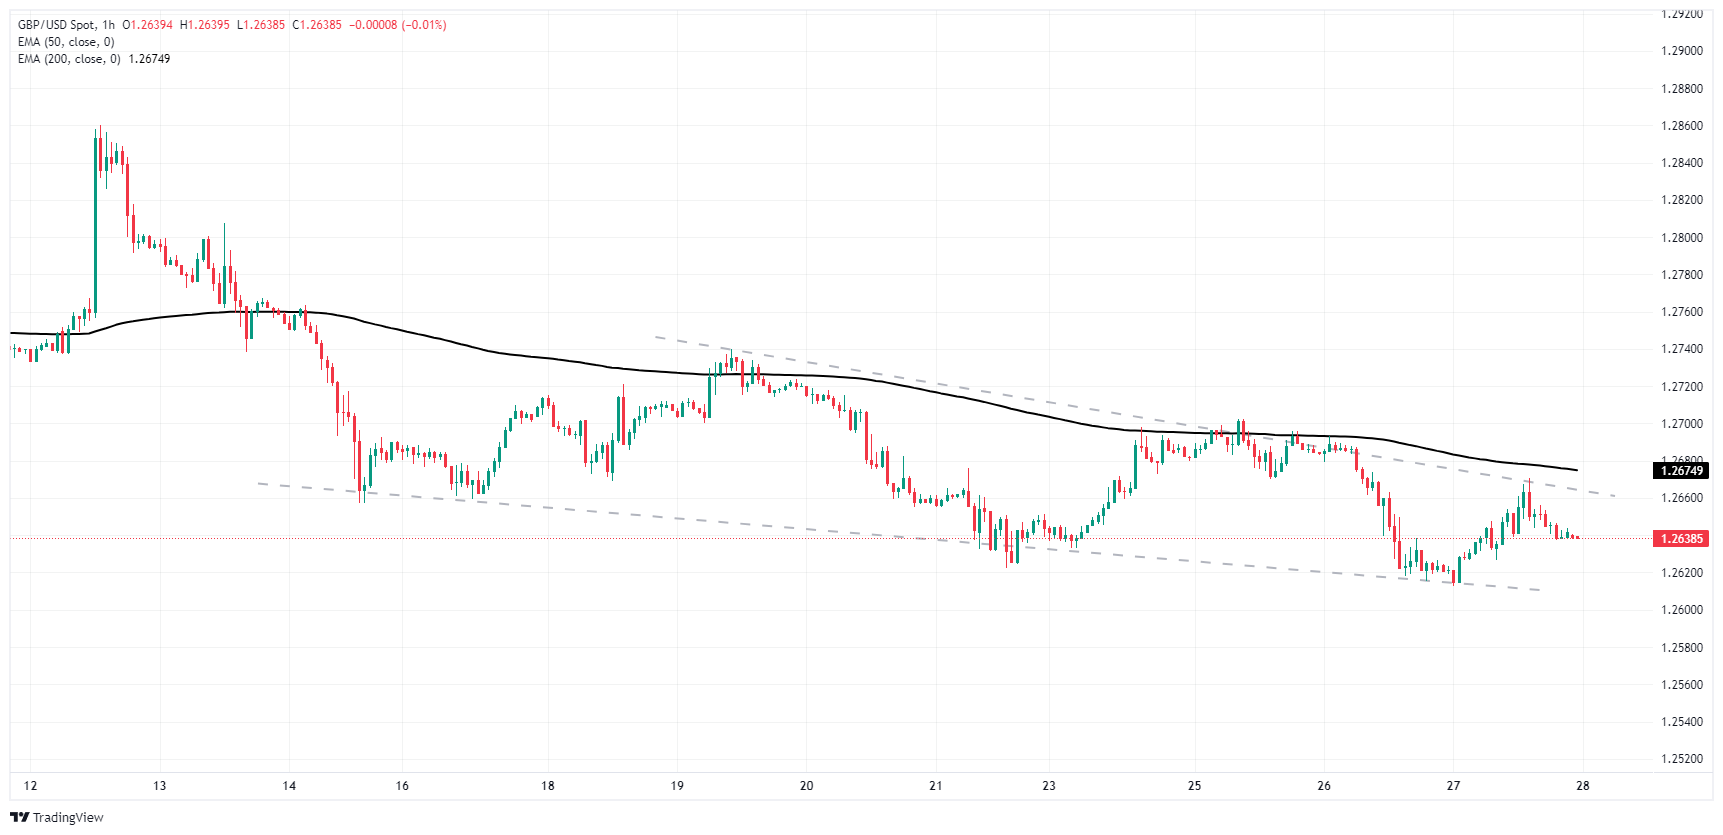
GBP/USD daily chart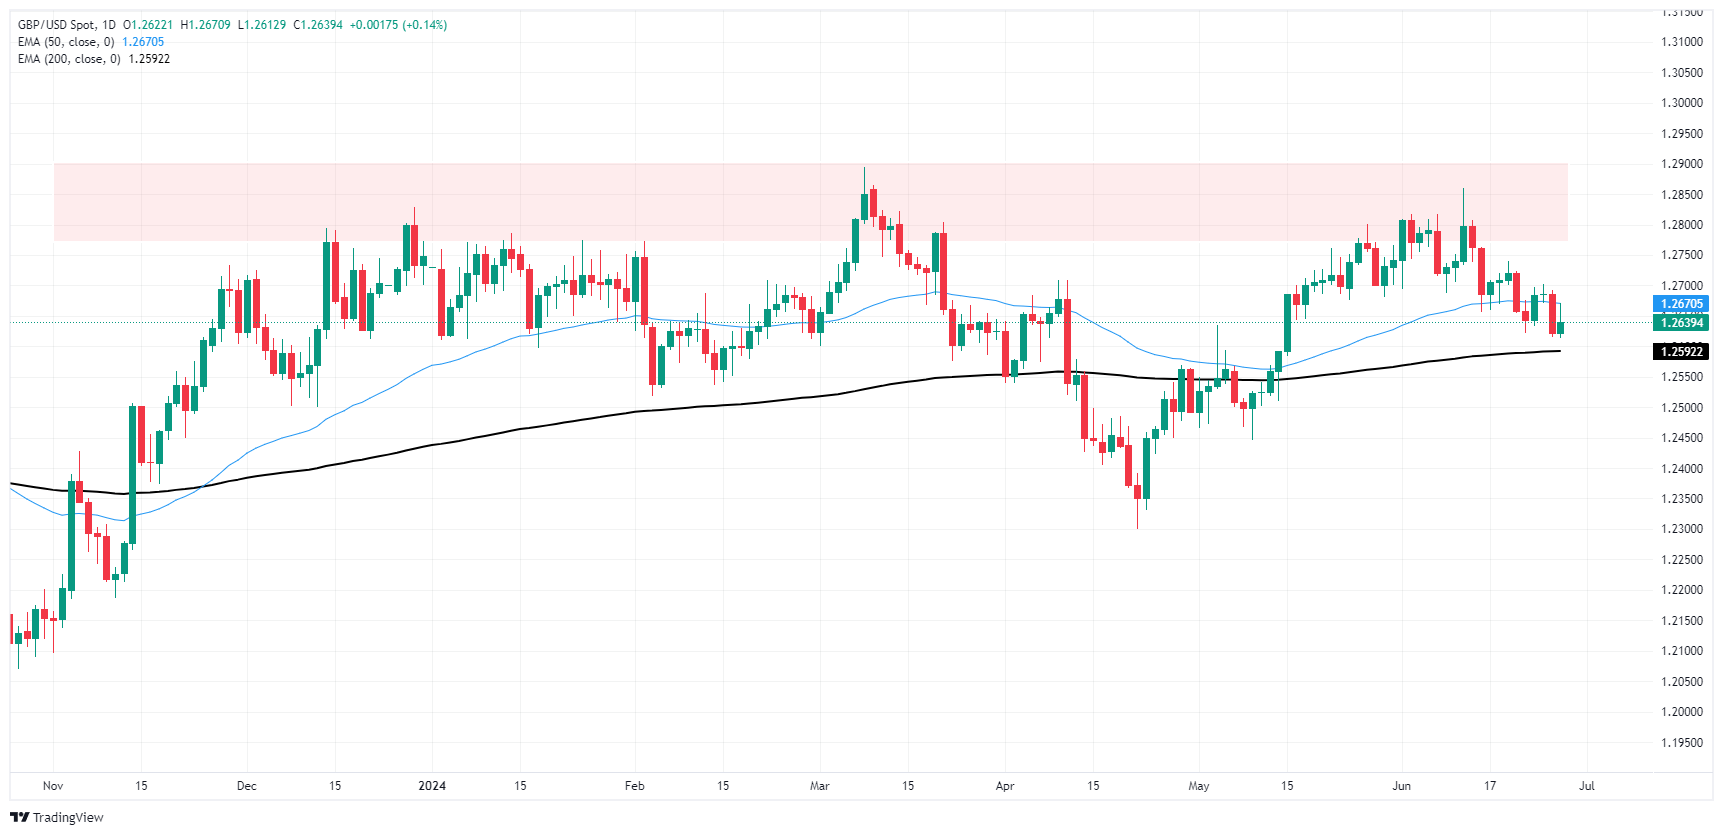
Pound Sterling FAQs
The Pound Sterling (GBP) is the oldest currency in the world (886 AD) and the official currency of the United Kingdom. It is the fourth most traded unit for foreign exchange (FX) in the world, accounting for 12% of all transactions, averaging $630 billion a day, according to 2022 data. Its key trading pairs are GBP/USD, aka ‘Cable’, which accounts for 11% of FX, GBP/JPY, or the ‘Dragon’ as it is known by traders (3%), and EUR/GBP (2%). The Pound Sterling is issued by the Bank of England (BoE).
The single most important factor influencing the value of the Pound Sterling is monetary policy decided by the Bank of England. The BoE bases its decisions on whether it has achieved its primary goal of “price stability” – a steady inflation rate of around 2%. Its primary tool for achieving this is the adjustment of interest rates. When inflation is too high, the BoE will try to rein it in by raising interest rates, making it more expensive for people and businesses to access credit. This is generally positive for GBP, as higher interest rates make the UK a more attractive place for global investors to park their money. When inflation falls too low it is a sign economic growth is slowing. In this scenario, the BoE will consider lowering interest rates to cheapen credit so businesses will borrow more to invest in growth-generating projects.
Data releases gauge the health of the economy and can impact the value of the Pound Sterling. Indicators such as GDP, Manufacturing and Services PMIs, and employment can all influence the direction of the GBP. A strong economy is good for Sterling. Not only does it attract more foreign investment but it may encourage the BoE to put up interest rates, which will directly strengthen GBP. Otherwise, if economic data is weak, the Pound Sterling is likely to fall.
Another significant data release for the Pound Sterling is the Trade Balance. This indicator measures the difference between what a country earns from its exports and what it spends on imports over a given period. If a country produces highly sought-after exports, its currency will benefit purely from the extra demand created from foreign buyers seeking to purchase these goods. Therefore, a positive net Trade Balance strengthens a currency and vice versa for a negative balance.
Author

Joshua Gibson
FXStreet
Joshua joins the FXStreet team as an Economics and Finance double major from Vancouver Island University with twelve years' experience as an independent trader focusing on technical analysis.


