|

GBP/USD pares some of Tuesday’s losses, back above 1.1560

  • UK inflation underpinned the Sterling, appreciating and recovering some ground vs. the buck.
  • US prices paid by producers dropped, flashing signs of easing.
  • GBP/USD Price Analysis: Break above 1.1600, to open the door for higher prices; otherwise, it might re-test the YTD lows.

The GBP/USD is trimming some of Tuesday’s losses after UK’s CPI showed signs of decelerating, while the US prices paid by producers for August ticked up, particularly in core PPI, in line with Tuesday’s CPI reading.

During the day, the GBP/USD hit a daily low of 1.1479. but edged higher, following the UK’s report, sending the GBP/USD above the 1.1500 figure towards its daily high at around current exchange rates. At the time of writing, the GBP/USD is trading at 1.1565, above its opening price by 0.65%.

The US Department of Labor reported on Wednesday that August’s Producer Price Index (PPI) moderated, dropping 0.1% MoM, aligned with forecasts, while the annual reading edged lower by a full percentage point to 8.7% vs. 9.8% in the previous month. Regarding core PPI, every month rose by 0.4% but annually exceeded estimations, topping at around 7.3%.

On the UK front, the Office for National Statistics (ONS) revealed that inflation ticked lower in August after breaking the 10% threshold, which was last seen in 40 years. Even though it’s good news for the Bank of England (BoE), it would not deter the central bank from increasing rates. Also, the appointment of a new Prime Minister in the figure of Liz Truss keeps market players at bay, waiting for its energy bill plan to kick in.

Analysts at ING wrote in a note that they expect the Bank of England (BoE) to raise rates by 50 bps next week, despite the environment not favoring the British pound. They added, “Slow growth and weaker equity markets should leave sterling as an underperformer.”

What to watch

An absent UK economic docket would keep traders leaning on US dollar dynamics. The US economic calendar will feature unemployment claims, the NY and Philly Fed Business Indices, alongside important Retail Sales figures.

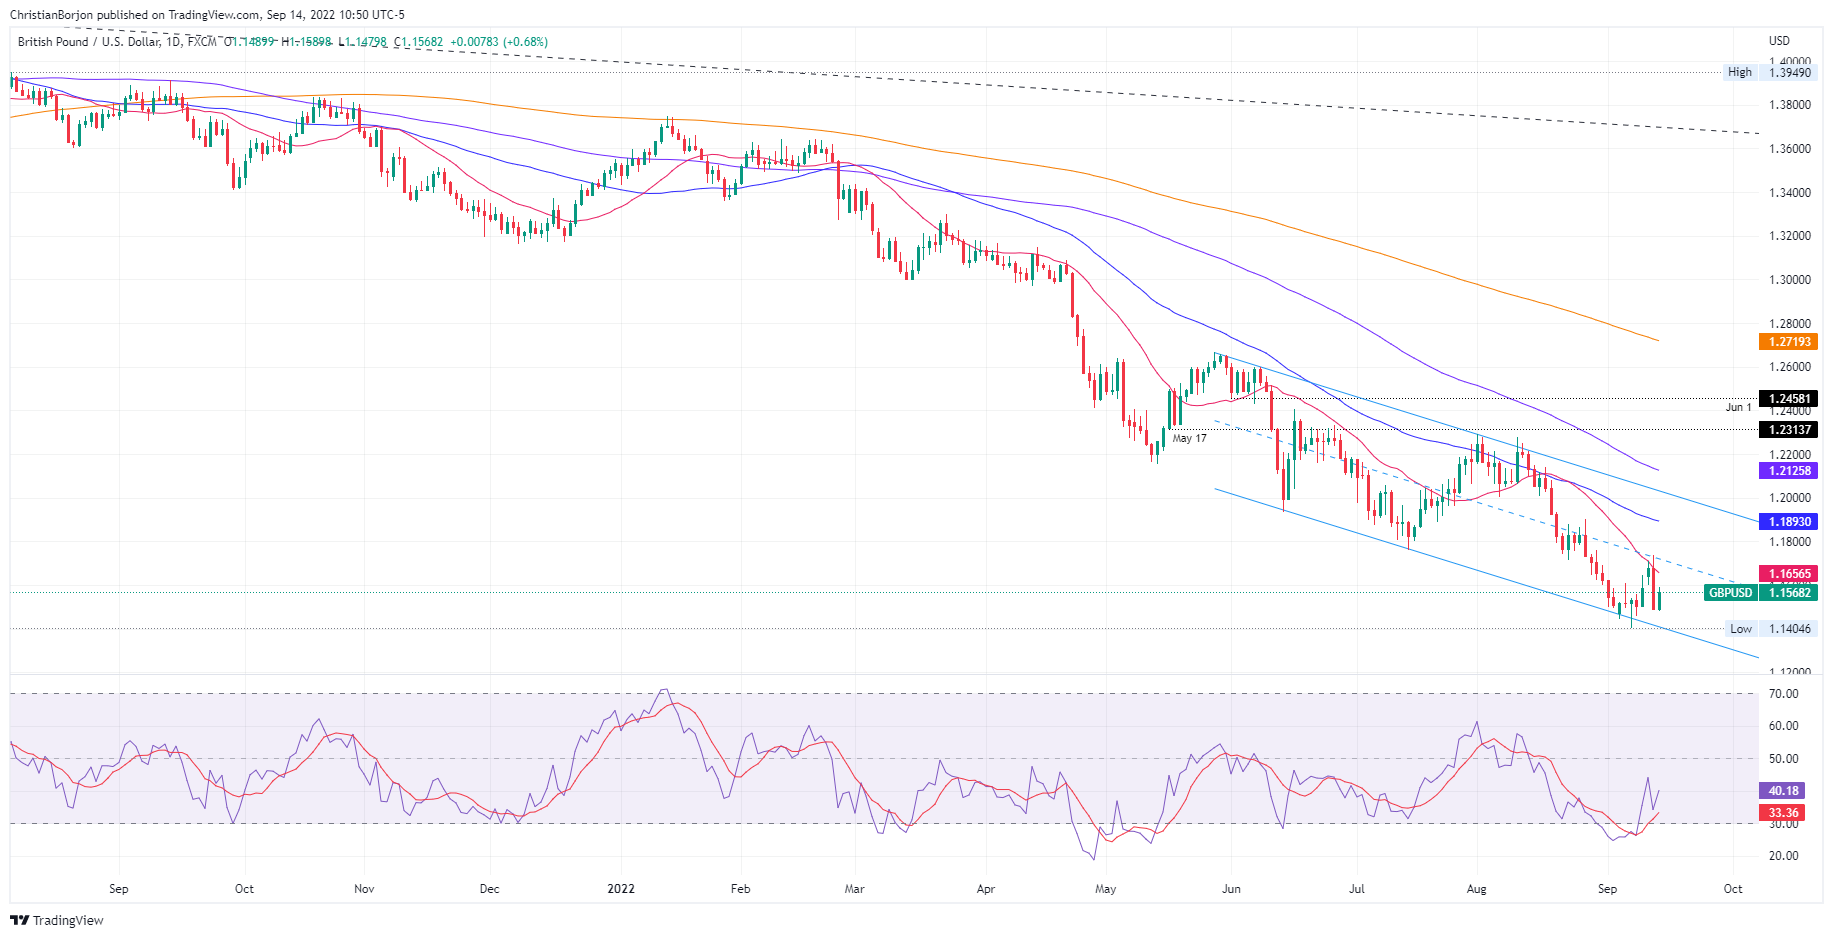
GBP/USD Price Analysis: Technical outlook

The GBP/USD daily chart depicts the pair recovering from weekly lows under the 1.1500 psychological level. A daily close above the September 12 low at 1.1600 would pave the way towards the 1.1700 figure, but a tranche of US economic data, ahead of the FOMC’s meeting, might refrain traders from opening fresh bets vs. the greenback. On the downside, a break below 1.1500 will re-expose the YTD low at 1.1404.

GBP/USD

Overview
Today last price1.1565
Today Daily Change0.0082
Today Daily Change %0.71
Today daily open1.1493
 
Trends
Daily SMA201.1683
Daily SMA501.1902
Daily SMA1001.2138
Daily SMA2001.2731
 
Levels
Previous Daily High1.1738
Previous Daily Low1.1492
Previous Weekly High1.1648
Previous Weekly Low1.1405
Previous Monthly High1.2294
Previous Monthly Low1.1599
Daily Fibonacci 38.2%1.1586
Daily Fibonacci 61.8%1.1644
Daily Pivot Point S11.141
Daily Pivot Point S21.1328
Daily Pivot Point S31.1164
Daily Pivot Point R11.1656
Daily Pivot Point R21.182
Daily Pivot Point R31.1903

Author

Christian Borjon Valencia

Markets analyst, news editor, and trading instructor with over 14 years of experience across FX, commodities, US equity indices, and global macro markets.

More from Christian Borjon Valencia
Share:

Editor's Picks

AUD/USD eyes 0.7150 barrier nine-day EMA

AUD/USD inches higher after registering modest losses in the previous day, trading around 0.7130 during the Asian hours. The technical analysis of the daily chart indicates that the pair is moving sideways within the rectangle pattern, suggesting a consolidation as neither the bulls nor the bears have enough momentum to take control of the market.

USD/JPY trades below 160.00 intervention threshold; bullish bias intact

The USD/JPY pair attracts some sellers during the Asian session amid fears that authorities will step in again to prop up the Japanese Yen. Furthermore, the Israel-Lebanon truce prompts some profit-taking around the US Dollar and exerts downward pressure on the currency pair.

Gold defends 200-day SMA, rises toward $4,500

Gold is attempting a tepid recovery toward $4,500 on Thursday, as renewed optimism in the Mideast geopolitical front calms market nerves. This cautious optimism across Asian markets weighs on Oil prices, and diminishes the US Dollar’s safe-haven appeal, helping Gold stage a decent comeback from the weekly low of $4,424.


Hyperliquid: ETF demand, capital rotation fuel HYPE rally as Bitcoin melts

Hyperliquid price sustains an upward trend near its all-time high of $75.76 on Thursday after posting 80% gains in May, while Bitcoin (BTC) retraces below $65,000, triggering a market-wide panic.

Kevin Warsh takes the Fed helm: What it means for the US Dollar
The Federal Reserve moves away from the highly predictable "forward guidance" model of the Jerome Powell era to a new “Kevin Warsh environment”, characterized by less communication, more policy surprises, and an increased focus on the Fed's complex balance sheet.
Recession on paper: What really moves the Canadian Loonie now?

Statistics Canada handed the headline writers a gift and the analysts a headache. Real GDP shrank 0.1% on an annualized basis in the first quarter, and with the fourth quarter of 2025 revised down to a 1.0% contraction, that is two negative quarters in a row, the textbook definition of a technical recession and Canada's first since the pandemic.

GBP/USD pares some of Tuesday’s losses, back above 1.1560