GBP/USD middles as markets await a reason to move
- GBP/USD traded in a circle on Wednesday, testing 1.2700.
- Key figures for both the US and UK due later in the week.
- GDP updates due on both sides of the Atlantic, US PCE inflation slated for Friday.

GBP/USD treaded water on Tuesday as investors mostly stood pat with a lack of meaningful data to drive market bets in either direction. The pair drifted in a slow circle near the 1.2700 handle, with a data-light Wednesday on the offer for the mid-week market session.
Forex Today: The FX universe remains in waiting mode
Data was notably thin on the Tuesday market session with the UK absent from the data docket and US data strictly mid-tier. The Richmond Fed’s Manufacturing Index declined sharply to -10 in June, down sharply from the previous print of 0 and entirely missing the forecast increase to 2. The CB Consumer Confidence survey index also eased back, but not as much as expected as the sentiment indicator ticked down to 100.4 from the previous 102.0 but stopping just short of the forecast 100.0.
The week’s noteworthy data releases will kick off on Thursday with the Bank of England’s )BoE) latest Financial Stability Report, followed by US Durable Goods Orders and US Gross Domestic Product (GDP) revisions for the first quarter.
Friday will round out an otherwise low-impact trading week with the UK’s own GDP quarterly revisions, followed by the latest print of the US’ Personal Consumption Expenditure Price Index (PCE) inflation. As one of the Federal Reserve’s (Fed) favored inflation metrics, investors will be looking for a continued cooling in critical US inflation figures to keep the Fed on pace to deliver a first rate cut when the Federal Open Market Committee (FOMC) meets on September 18.
GBP/USD technical outlook
GBP/USD continues to tilt towards the low side as near-term price action gets hung up on the 200-hour Exponential Moving Average (EMA) near 1.2693. The 1.2700 handle is proving too tough of a barrier for bulls to crack on intraday charts, and a continued softening of upside momentum could drag the pair into fresh July lows below 1.2630.
Daily candlesticks remain mired in technical congestion at the 50-day EMA near 1.2673, and the Cable continues to trade on the low side of a supply zone priced in above 1.2800.
GBP/USD hourly chart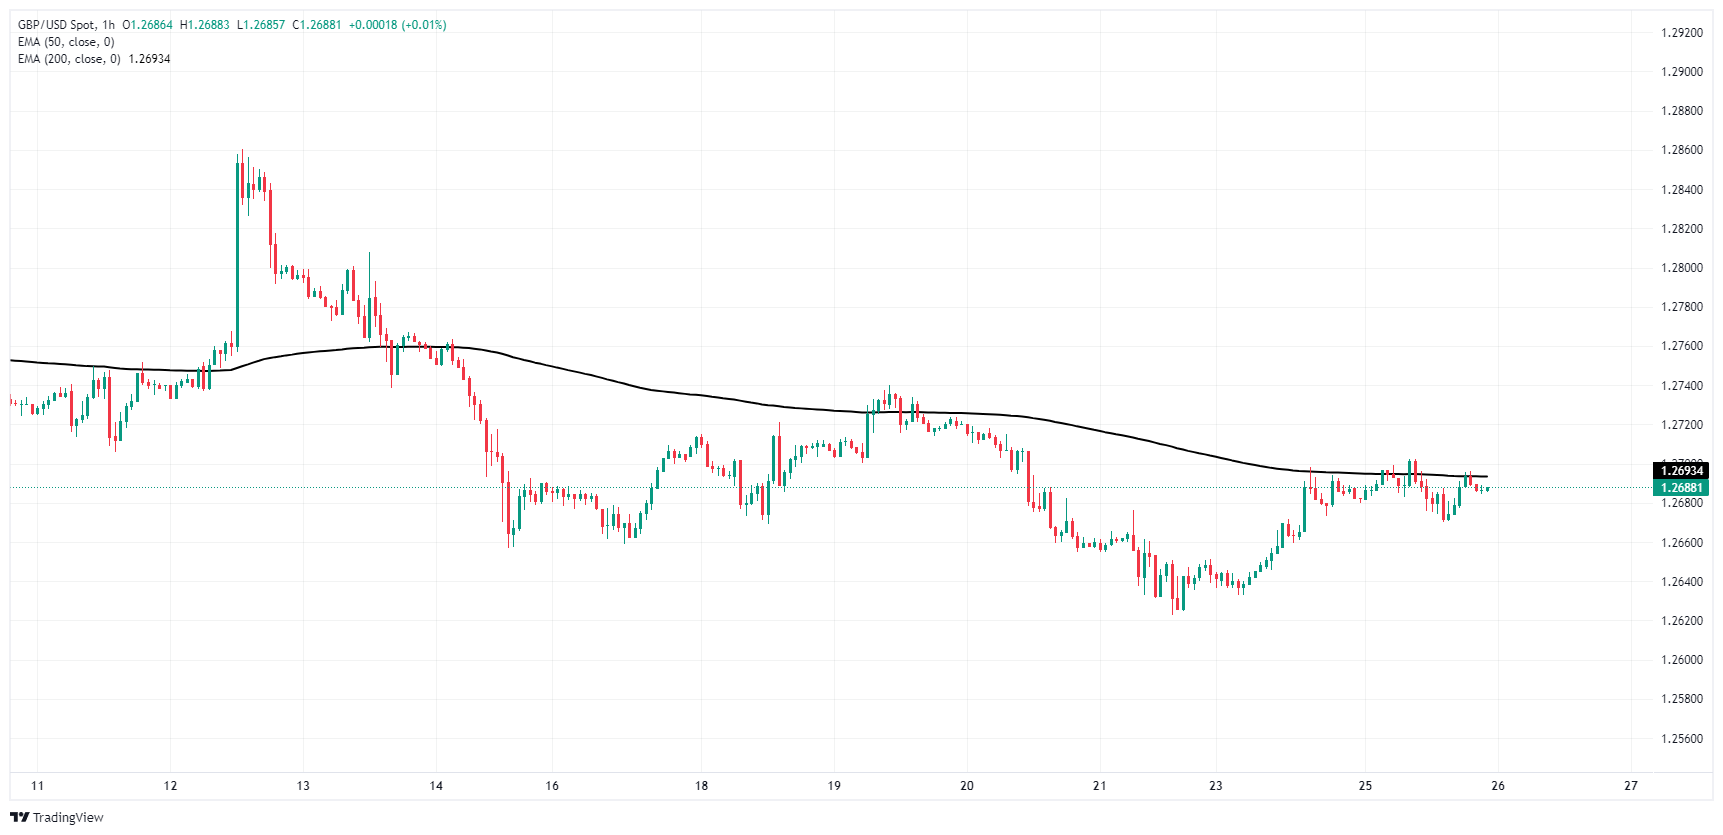
GBP/USD daily chart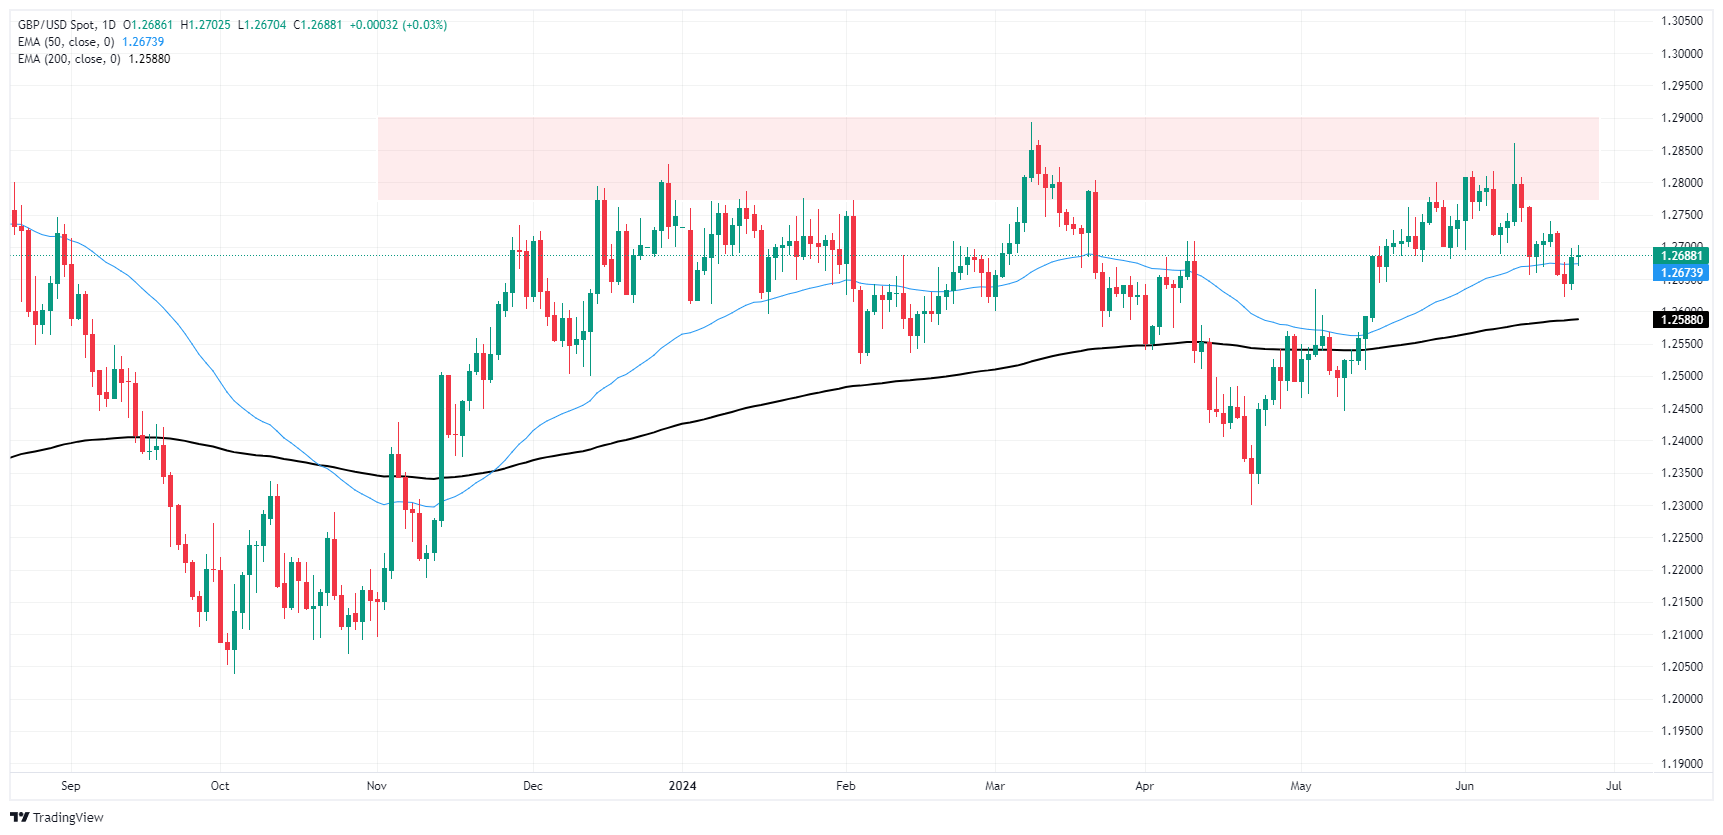
Pound Sterling FAQs
The Pound Sterling (GBP) is the oldest currency in the world (886 AD) and the official currency of the United Kingdom. It is the fourth most traded unit for foreign exchange (FX) in the world, accounting for 12% of all transactions, averaging $630 billion a day, according to 2022 data. Its key trading pairs are GBP/USD, aka ‘Cable’, which accounts for 11% of FX, GBP/JPY, or the ‘Dragon’ as it is known by traders (3%), and EUR/GBP (2%). The Pound Sterling is issued by the Bank of England (BoE).
The single most important factor influencing the value of the Pound Sterling is monetary policy decided by the Bank of England. The BoE bases its decisions on whether it has achieved its primary goal of “price stability” – a steady inflation rate of around 2%. Its primary tool for achieving this is the adjustment of interest rates. When inflation is too high, the BoE will try to rein it in by raising interest rates, making it more expensive for people and businesses to access credit. This is generally positive for GBP, as higher interest rates make the UK a more attractive place for global investors to park their money. When inflation falls too low it is a sign economic growth is slowing. In this scenario, the BoE will consider lowering interest rates to cheapen credit so businesses will borrow more to invest in growth-generating projects.
Data releases gauge the health of the economy and can impact the value of the Pound Sterling. Indicators such as GDP, Manufacturing and Services PMIs, and employment can all influence the direction of the GBP. A strong economy is good for Sterling. Not only does it attract more foreign investment but it may encourage the BoE to put up interest rates, which will directly strengthen GBP. Otherwise, if economic data is weak, the Pound Sterling is likely to fall.
Another significant data release for the Pound Sterling is the Trade Balance. This indicator measures the difference between what a country earns from its exports and what it spends on imports over a given period. If a country produces highly sought-after exports, its currency will benefit purely from the extra demand created from foreign buyers seeking to purchase these goods. Therefore, a positive net Trade Balance strengthens a currency and vice versa for a negative balance.
Author

Joshua Gibson
FXStreet
Joshua joins the FXStreet team as an Economics and Finance double major from Vancouver Island University with twelve years' experience as an independent trader focusing on technical analysis.


