|

GBP/USD loses the 20-day SMA post US NFP

  • Cable fell below the 20-day SMA toward the 1.2450 area.
  • The US added 339k new jobs in May vs 190k expected.
  • US bond yields increased as a reaction to the employment figures.

The GBP/USD fell more than 0.50% to a daily low of 1.2453 at the end of the week, following robust labor market data from the US, indicating a possible reconsideration of further rate hikes by the Federal Reserve (Fed). As a result, the US Dollar strengthened due to rising US bond yields, while the Sterling Pound continued to face selling pressure while the British economic calendar had nothing relevant to offer.

Robust labor market made markets reconsider a possible hike by the Fed

The US Bureau of Labor Statistics revealed that employment in the US increased by 339k, surpassing the consensus forecast of 190k. However, the Unemployment rate rose to 3.7% compared to the expected 3.5%. Wage inflation, measured by Average Hourly Earnings, stood at 4.3% YoY, slightly lower than the anticipated 4.4%.

Despite labor demand beginning to exhibit signs of deceleration, the robust employment growth and ongoing inflationary pressures are exerting force on the Fed to contemplate interest rate hikes. This has resulted in an upswing in US bond yields, reflecting heightened market expectations for a 25 basis points hike in the upcoming June meeting. In that sense, the US bond yields are experiencing increases across the curve. The 10-year bond yield increased by 2.33%, reaching 3.68%. Similarly, the 2-year yield stands at 4.50% with a gain of 4.69%, and the 5-year yield is at 3.83% up by 3.53%.

However, as per the CME FedWatch tool, markets are still discounting higher odds of no hike, although the case for a 25 bps gain has strengthened. Before the meeting, the Federal Open Market Committee will know the May inflation reading, which will finally model the expectations for their next interest rate decision.
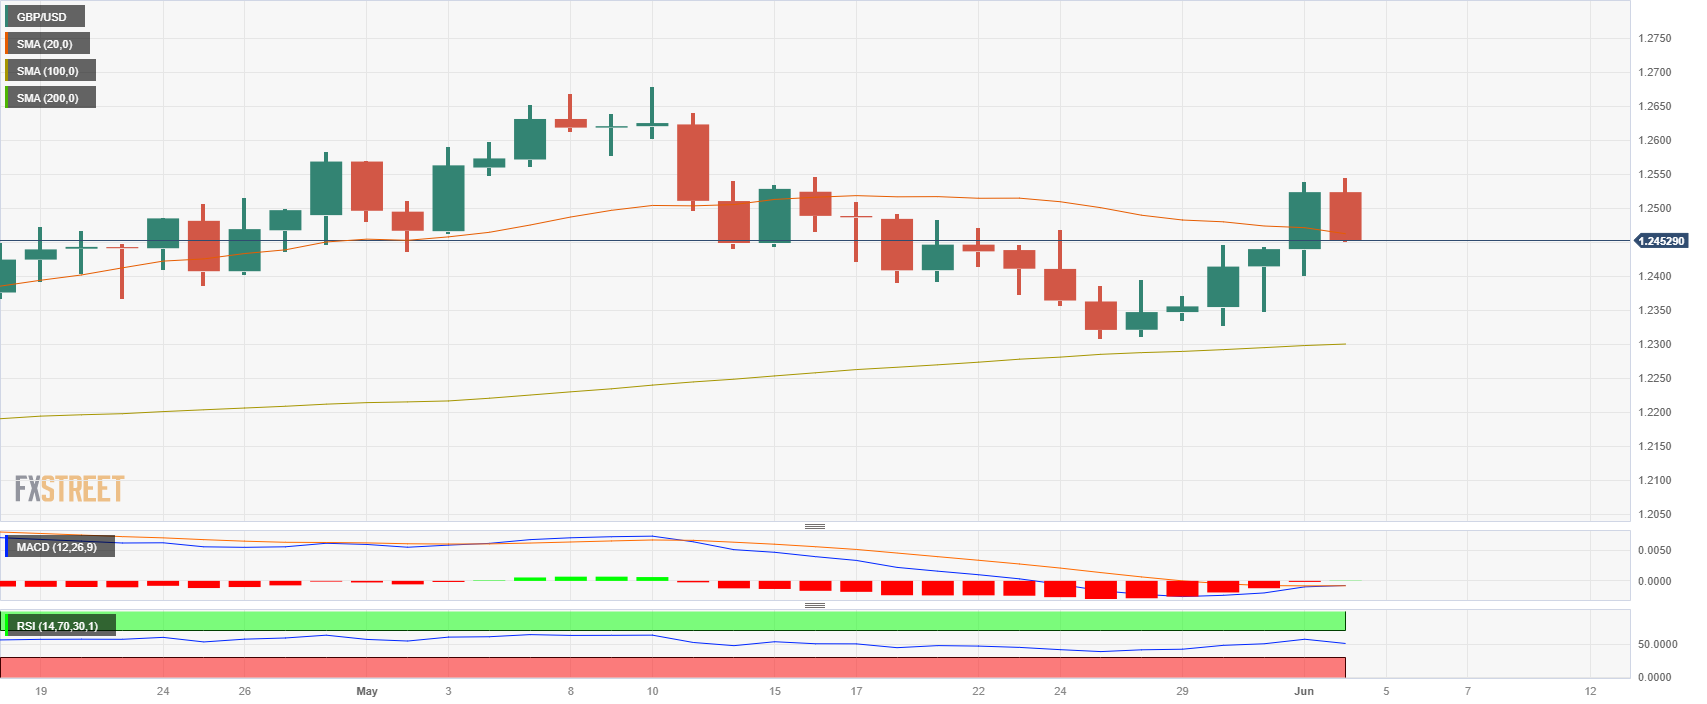
Levels to watch

The GBP/USD holds a slightly bearish outlook for the short term, as per the daily chart. The Relative Strength Index (RSI) fell towards its midpoint while Moving Average Convergence Divergence (MACD) turned flat. However the pair still holds above the 100 and 200-day Simple Moving Averages (SMA) while bulls try to retake the 20-day rolling average at the 1.2460 zone.

If the Cable falls, immediate support levels are seen at the daily low area around 1.2350 and the 1.2400 level. Furthermore, to regain traction the bulls must consolidate the 20-day SMA at the 1.2461 area. Above, resistances stand at 1.2480 and 1.2500.

GBP/USD

Overview
Today last price1.2448
Today Daily Change-0.0076
Today Daily Change %-0.61
Today daily open1.2524
 
Trends
Daily SMA201.2472
Daily SMA501.2449
Daily SMA1001.2298
Daily SMA2001.1991
 
Levels
Previous Daily High1.254
Previous Daily Low1.2401
Previous Weekly High1.2472
Previous Weekly Low1.2308
Previous Monthly High1.268
Previous Monthly Low1.2308
Daily Fibonacci 38.2%1.2487
Daily Fibonacci 61.8%1.2454
Daily Pivot Point S11.2437
Daily Pivot Point S21.235
Daily Pivot Point S31.2298
Daily Pivot Point R11.2575
Daily Pivot Point R21.2627
Daily Pivot Point R31.2714

Author

Patricio Martín

Patricio is an economist from Argentina passionate about global finance and understanding the daily movements of the markets.

More from Patricio Martín
Share:

Markets move fast. We move first.

Orange Juice Newsletter brings you expert driven insights - not headlines. Every day on your inbox.

By subscribing you agree to our Terms and conditions.

Editor's Picks

EUR/USD trades around 1.1700 after rebounding from 50-day EMA

EUR/USD gains ground after three days of losses, trading around 1.1700 during the Asian hours on Wednesday. On the daily chart, technical analysis indicates a potential for a bearish bias; the 14-day Relative Strength Index at 47 confirms waning momentum.

GBP/USD consolidates around 1.3500; looks to US macro data for fresh impetus

The GBP/USD pair oscillates in a narrow range, around the 1.3500 psychological mark during the Asian session on Wednesday, and for now, seems to have stalled the previous day's retracement slide from its highest level since September 18. Moreover, the fundamental backdrop seems tilted in favor of bullish traders and suggests that the path of least resistance for spot prices is to the upside.

Gold sees profit-taking decline after facing rejection at $4,500

Gold price sees a decline on profit-taking after facing rejection at $4,500 in the Asian trading hours on Wednesday. Despite the pullback, the traditional safe haven remains underpinned by geopolitical tensions and expectations of Fed rate cuts. The US ADP Jobs data, JOLTS Job Openings Survey and ISM Services Purchasing Managers Index report will be published on Wednesday. 

Pump.fun prepares for early-year rally as DEX volume skyrockets

Pump.fun (PUMP) is rising alongside crypto majors such as Bitcoin (BTC) and is trading above $0.002400 at the time of writing on Tuesday. The Decentralized Exchange (DEX) native token outlook builds on a bullish tone developed since December 30.

Implications of US intervention in Venezuela

Events in Venezuela are top of mind for market participants, and while developments are associated with an elevated degree of uncertainty, we are not making any changes to our markets or economic forecasts as a result of the deposition of Nicolás Maduro. 

Cardano holds steady as bulls intensify push for breakout

Cardano rises above the 50-day EMA resistance amid a risk-on mood across the crypto market. The MACD upholds positive divergence, increasing the potential for a 20% breakout to $0.505.