GBP/USD holds steady around the 20-day EMA, on mixed US data
- GBP/USD rate hovers above the 1.2400 mark after the last week’s USD boost from stronger-than-expected jobs data.
- US economic indicators reveal a mixed story, with weakening factory orders and a fall in Non-Manufacturing PMI.
- UK outpaces expectations with S&P Global Services and Composite PMIs, adding pressure on the Bank of England to address inflation concerns.

GBP/USD trims some of its losses but remains trading below its opening price; after the latest week, robust jobs reports boosted the American Dollar (USD), but Monday’s agenda capped the USD gains. Therefore, the GBP/USD is exchanging hands at 1.2440, 0.04% below its opening price but higher than the day’s low of 1.2368.
GBP/USD slashes early losses on weakening US factory orders and falling Treasury bond yields, limiting US Dollar gains as the UK PMI beats estimates
Last week, the US Bureau of Labor Statistics (BLS) revealed May’s data, showing the creation of more than 300K jobs, thought flashed the Unemployment Rate at 3.7%, sought by the US Federal Reserve (Fed), as a sign the economy is cooling and unexpectedly boosted the US Dollar (USD), as the GBP/USD retreated last Thursday¿s gains.
But on Monday, the story is different as Factory Orders in the US weakened, from 0.6% to 0.4% in May, less than estimations. Core Orders, excluding transportation, plummeted 0.2% but improved compared with March’s 0.7% drop. At the same time, the Institute for Supply Management (ISM) revealed that the Non-Manufacturing PMI fell to 50.9 from April’s 51.9, portraying that the economy is weakening.
After the data was released, the greenback weakened, as shown by the US Dollar Index (DXY), which tracks the buck’s value vs. a basket of peers. The DXY d down 0.09%, at 103.947, failing to crack the 104.000 mark, weighed by falling US Treasury bond yields. The US 10-year Treasury bond yield drops two basis points, at 3.677%.
On the UK front, the S&P Global Services and Composite PMIs beat estimates, with the Services Index registering a 55.2, exceeding forecasts of 55.1, though less than April’s 55.9. However, price input pressures rose the most in three months, with wages being the main reason. That would keep the Bank of England (BoE) pressured to deliver further tightening as inflation proves to be stickier than expected.
GBP/USD Price Analysis: Technical outlook
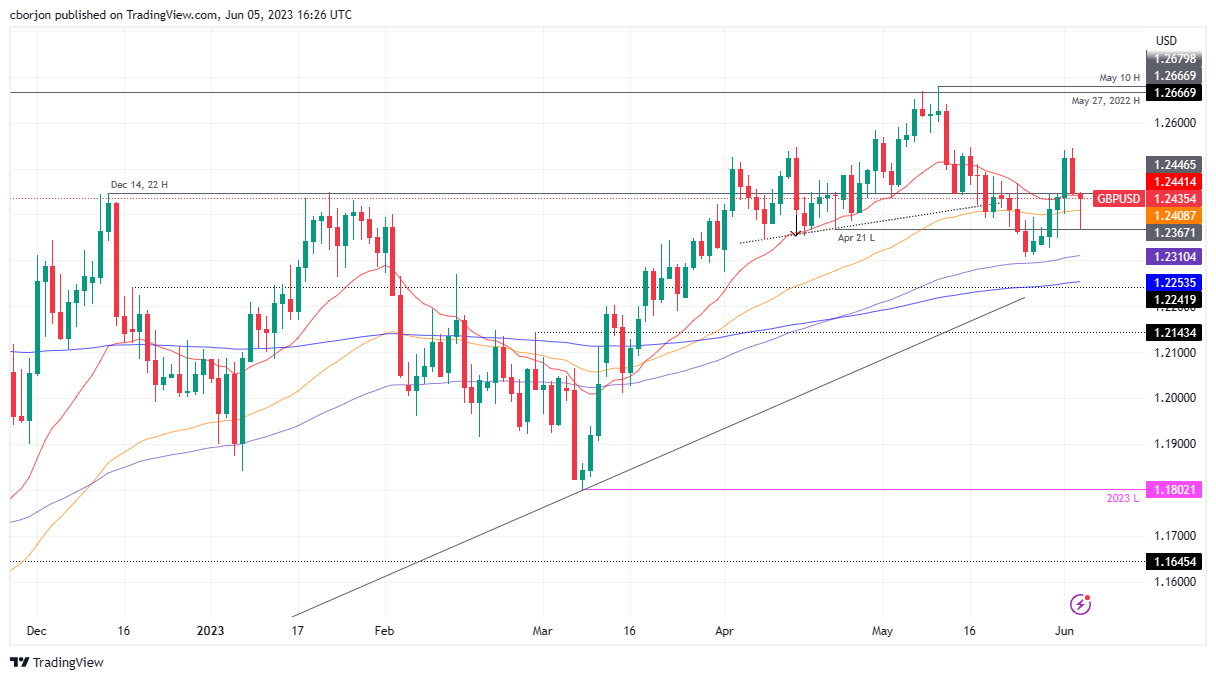
Given the fundamental backdrop, the GBP/USD is neutral to upward biased. In fact, today’s price action forming a gravestone doji or a hammer would put the 1.2500 figure into play. Still, traders must reclaim the 20-day Exponential Moving Average (EMA) resistance at 1.2442, followed by 1.2450. Once cleared, that could pave the way towards 1.2500. Conversely, the GBP/USD first support would be the 1.2400 figure, followed by the current week’ slow of 1.2368.
Author

Christian Borjon Valencia
FXStreet
Markets analyst, news editor, and trading instructor with over 14 years of experience across FX, commodities, US equity indices, and global macro markets.

















