GBP/USD floats around 1.3320 as softer US CPI reinforces Fed cut bets
- GBP/USD rises 0.07% to 1.3319 as traders digest last week's softer US inflation data.
- Headline and core CPI came in at 3% YoY, slightly below forecasts, bolstering Fed rate-cut expectations.
- UK inflation slowdown boosts odds of a December BoE rate cut to 67%.

GBP/USD pares some of last Friday’s losses and edges up moderately on Monday as the latest US inflation report might not deter the Federal Reserve (Fed) from cutting rates this week. At the time of writing, the pair trades at 1.3319, up 0.07%.
Sterling finds support from improved risk mood ahead of Trump–Xi meeting
The US Consumer Price Index (CPI) in headline and core prints was 3% YoY, slightly below estimates of 3.1% amid the lack of economic data releases due to the US government shutdown.
Optimism amongst investors that the US-China trade war could de-escalate pushed high beta currencies, like Sterling, higher. This week, US President Donald Trump and Chinese President Xi Jinping will meet in South Korea by the end of the week.
Across the pond, the UK’s inflation eased, prompting investors to increase bets that the Bank of England (BoE) could cut rates at its December meeting, up to 67% from 50% a week ago.
Analysts mentioned by Reuters stated that “Fiscal events remain the dominant factor for the Pound in the medium term, and we stand by our view that the bar for a positive outcome for Sterling is not particularly high.”
Regarding the UK’s Autumn Budget, investors had priced in that Chancellor Rachel Reeves will raise tens of billions of Sterling in taxes to meet her fiscal targets, once she announces the plan on November 26.
GBP/USD Price Forecast: Technical outlook
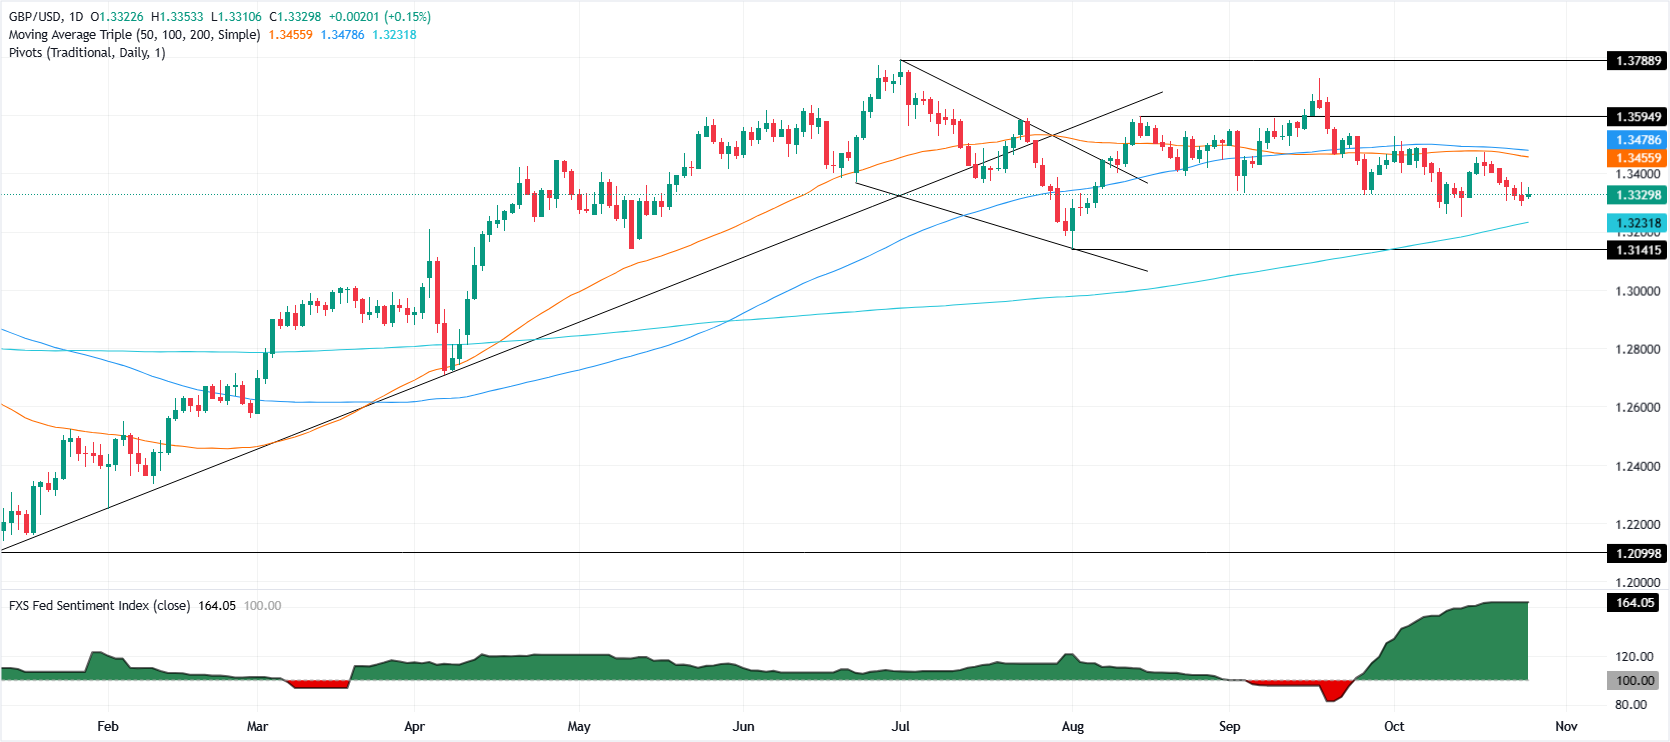
The technical picture shows GBP/USD remains downward biased, but if it clears key resistance levels, it could challenge the 1.3400 figure in the short term. The Relative Strength Index (RSI) remains bearish, though shows that buyers are gathering some steam.
If GBP/USD clears the 20-day SMA at 1.3388, this opens the path to 1.3400. On further strength, the pair could aim towards the 50- and 100-day SMAs, each at 1.3453 and 1.3475, respectively. Conversely, if GBP/USD slides beneath 1.3300, the next support would be the 200-day SMA at 1.3226, before testing 1.3200.
Pound Sterling Price This Month
The table below shows the percentage change of British Pound (GBP) against listed major currencies this month. British Pound was the strongest against the Japanese Yen.
| USD | EUR | GBP | JPY | CAD | AUD | NZD | CHF | |
|---|---|---|---|---|---|---|---|---|
| USD | 0.84% | 0.85% | 3.49% | 0.54% | 0.89% | 0.54% | -0.00% | |
| EUR | -0.84% | 0.02% | 2.64% | -0.30% | 0.07% | -0.27% | -0.84% | |
| GBP | -0.85% | -0.02% | 2.63% | -0.32% | 0.05% | -0.29% | -0.85% | |
| JPY | -3.49% | -2.64% | -2.63% | -2.84% | -2.53% | -2.63% | -3.29% | |
| CAD | -0.54% | 0.30% | 0.32% | 2.84% | 0.35% | 0.03% | -0.55% | |
| AUD | -0.89% | -0.07% | -0.05% | 2.53% | -0.35% | -0.34% | -0.91% | |
| NZD | -0.54% | 0.27% | 0.29% | 2.63% | -0.03% | 0.34% | -0.57% | |
| CHF | 0.00% | 0.84% | 0.85% | 3.29% | 0.55% | 0.91% | 0.57% |
The heat map shows percentage changes of major currencies against each other. The base currency is picked from the left column, while the quote currency is picked from the top row. For example, if you pick the British Pound from the left column and move along the horizontal line to the US Dollar, the percentage change displayed in the box will represent GBP (base)/USD (quote).
Author

Christian Borjon Valencia
FXStreet
Markets analyst, news editor, and trading instructor with over 14 years of experience across FX, commodities, US equity indices, and global macro markets.

















