GBP/USD edges lower to 1.3220 as market leans bearish post-budget
- GBP/USD pulls back as thin liquidity and the Autumn Budget spark profit-taking near recent highs.
- Fed cut odds rise to 87% after dovish New York Fed John Williams.
- Evening-star pattern and weakening RSI signal a deeper pullback toward key support levels.

GBP/USD dips during the North American session on Friday, despite heading into the end of the week with gains of almost 1%, after the financial markets digest the Autumn Budget. The pair trades at 1.3221 after retreating from a daily high of 1.3244.
Sterling pares weekly gains as dovish Fed bets rise but BoE cut expectations weigh on Cable
The US economic docket was shortened by the Thanksgiving holiday. Nevertheless, softer inflation prints, with the Core Producer Price Index (PPI) for September diving from 2.9% to 2.6% and a dip in Initial Jobless Claims from 222K in the week ending November 15 to 216K for the last week finishing November 22, strengthened the case for a pause on the Federal Reserve's (Fed) easing cycle.
Nevertheless, dovish comments by the New York Fed John Williams increased the chances of a 25-basis-point rate cut by the US central bank at the December meeting. As of writing, odds stand at 87%, according to the FedWatch tool.
In the UK, Rachel Reeves pushed back against critics of the government’s spending budget, which would fund extra welfare spending by hiking taxes. They plan to raise taxes by £26 billion.
Following the release of the budget, Cable rose past 1.3200, but since peaking at 1.3268, the pair retreated with sellers expecting a break below 1.3200. It is worth noting that money markets are pricing in a 25-bps rate cut by the Bank of England (BoE), hence further downside fort GBP/USD is expected.
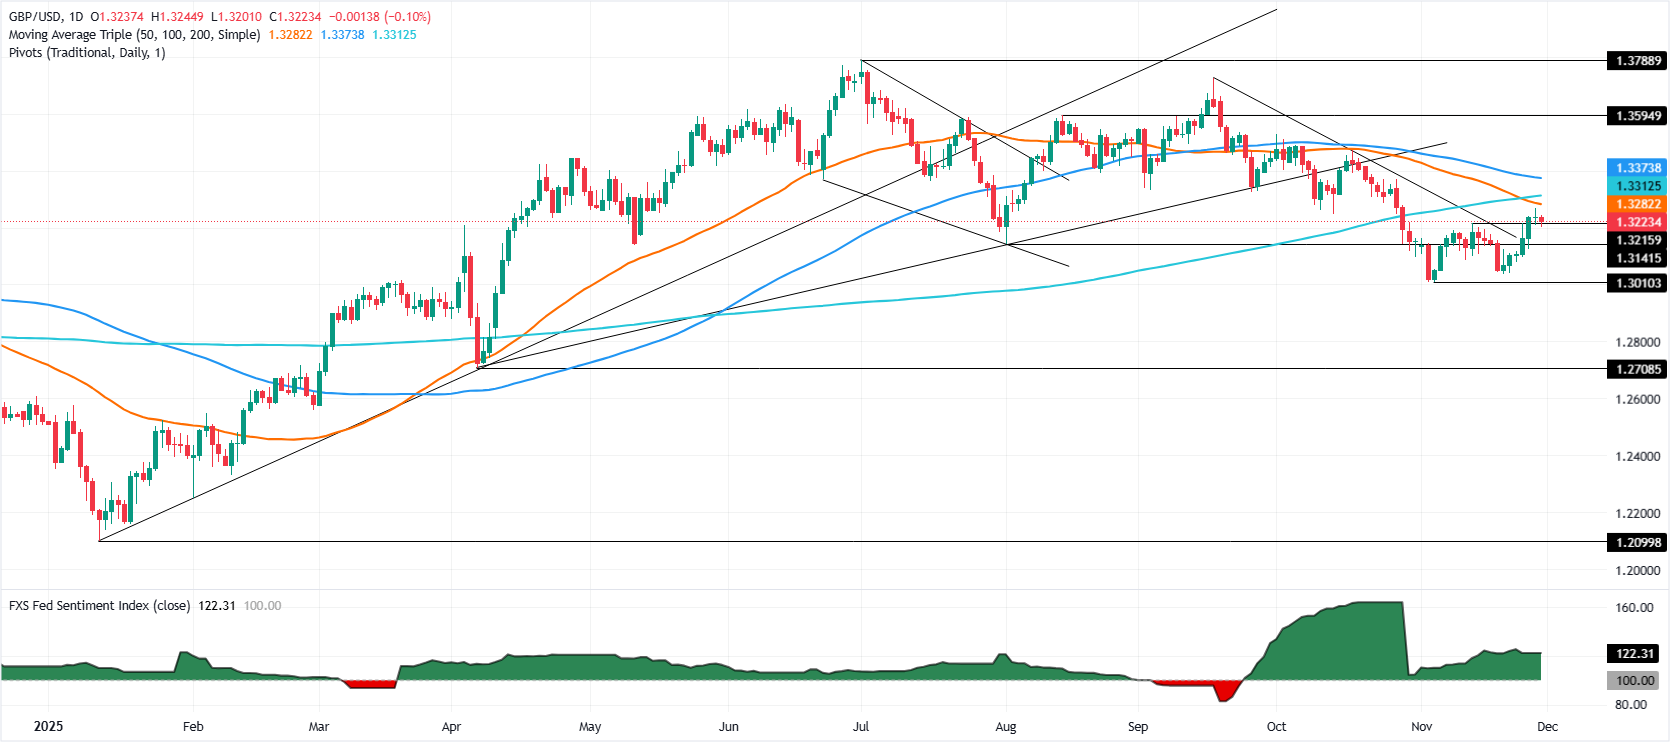
GBP/USD Price Forecast: Technical outlook
GBP/USD seems to have peaked, as it is forming an ‘evening star’ candle chart pattern, after buyers failed to reclaim key resistance at the 50-day SMA at 1.3279. A daily close below 1.3200 could pave the way for further downside, with traders eyeing the 20-day SMA at 1.3139 seen as key support ahead of 1.3100 and of 1.3010, November’s bottom.
The Relative Strength Index (RSI) seems poised to turn bearish, aiming lower towards its neutral line, indicating that sellers are gathering momentum.
(This story was corrected on November 28 at 16:02 GMT to say that the previous reading of the core US PPI was 2.9%, not 2.8%.)
Pound Sterling Price This Month
The table below shows the percentage change of British Pound (GBP) against listed major currencies this month. British Pound was the strongest against the Japanese Yen.
| USD | EUR | GBP | JPY | CAD | AUD | NZD | CHF | |
|---|---|---|---|---|---|---|---|---|
| USD | -0.22% | -0.55% | 1.39% | -0.18% | 0.16% | 0.17% | 0.35% | |
| EUR | 0.22% | -0.33% | 1.63% | 0.05% | 0.37% | 0.39% | 0.57% | |
| GBP | 0.55% | 0.33% | 1.98% | 0.38% | 0.69% | 0.73% | 0.91% | |
| JPY | -1.39% | -1.63% | -1.98% | -1.60% | -1.26% | -1.24% | -1.09% | |
| CAD | 0.18% | -0.05% | -0.38% | 1.60% | 0.27% | 0.35% | 0.52% | |
| AUD | -0.16% | -0.37% | -0.69% | 1.26% | -0.27% | 0.03% | 0.22% | |
| NZD | -0.17% | -0.39% | -0.73% | 1.24% | -0.35% | -0.03% | 0.18% | |
| CHF | -0.35% | -0.57% | -0.91% | 1.09% | -0.52% | -0.22% | -0.18% |
The heat map shows percentage changes of major currencies against each other. The base currency is picked from the left column, while the quote currency is picked from the top row. For example, if you pick the British Pound from the left column and move along the horizontal line to the US Dollar, the percentage change displayed in the box will represent GBP (base)/USD (quote).
Author

Christian Borjon Valencia
FXStreet
Markets analyst, news editor, and trading instructor with over 14 years of experience across FX, commodities, US equity indices, and global macro markets.


