GBP/USD consolidates the recovery above 1.2200 ahead of US data


  • GBP/USD defends 1.2200 amid a broad US dollar pullback, positive mood.
  • Cable’s rebound appears capped amid the UK-US macro divergence.
  • GBP/USD jumps off falling wedge support on 4H but 21-SMA is the level to beat.

GBP/USD is moving back and forth in a 20-pips range in the European session, defending minor bids just above the 1.2200 level.

The recovery attempt in the pair could be attributed to a broad pullback in the US dollar vs. its main rivals from the highest level in two decades just shy of the 105.00 mark.

The positive shift in risk sentiment, in the wake of Shanghai reopening news, is boding ill for the safe-haven dollar. Although the further upside in cable remains elusive, thanks to the ongoing rally in the US Treasury yields across the curve.

The macroeconomic, as well as, the monetary policy divergence between the UK and the US economies will likely keep the pound undermined in the near term.

Attention now shifts towards the US Michigan Consumer Sentiment data and Fedspeak for fresh trading impetus. Next week, the focus will be on the US Retail Sales and the UK inflation data.

Looking at cable’s four-hour chart, the price staged a decent comeback after finding bids at 1.2165 on Thursday, which appeared to be the falling trendline (wedge) support.

Note that the major is traversing within a bullish wedge formation after the brief recovery on May 4 lost legs near the 1.2535 region.

The Relative Strength Index (RSI) has turned flat above the oversold region while below the midline, suggesting that the recovery momentum may be losing traction.

If the downside pressure accelerates, then a retest of the wedge support, now at 1.2136 will be challenged.

A breach of the latter will trigger a fresh drop towards the 1.2100.

GBP/USD: Four-hour chart

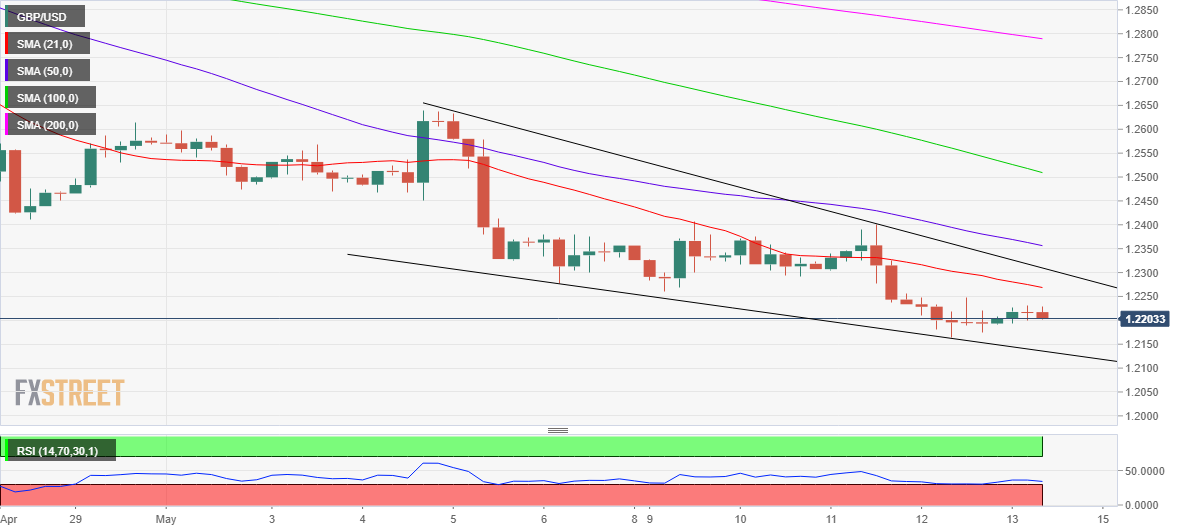
On the other side, any recovery attempts will need to recapture the immediate upside hurdle at 1.2250, above which the bearish 21-Simple Moving Average (SMA) at 1.2268 will be probed.

Further up, the falling trendline (wedge) resistance at 1.2309 will be the last line of defense for GBP sellers.

GBP/USD: Additional technical levels

GBP/USD

Overview
Today last price 1.2212
Today Daily Change 0.0011
Today Daily Change % 0.09
Today daily open 1.22
 
Trends
Daily SMA20 1.2618
Daily SMA50 1.2915
Daily SMA100 1.3221
Daily SMA200 1.3405
 
Levels
Previous Daily High 1.2256
Previous Daily Low 1.2165
Previous Weekly High 1.2638
Previous Weekly Low 1.2276
Previous Monthly High 1.3167
Previous Monthly Low 1.2411
Daily Fibonacci 38.2% 1.22
Daily Fibonacci 61.8% 1.2221
Daily Pivot Point S1 1.2158
Daily Pivot Point S2 1.2116
Daily Pivot Point S3 1.2068
Daily Pivot Point R1 1.2249
Daily Pivot Point R2 1.2298
Daily Pivot Point R3 1.2339


Share: Feed news

Information on these pages contains forward-looking statements that involve risks and uncertainties. Markets and instruments profiled on this page are for informational purposes only and should not in any way come across as a recommendation to buy or sell in these assets. You should do your own thorough research before making any investment decisions. FXStreet does not in any way guarantee that this information is free from mistakes, errors, or material misstatements. It also does not guarantee that this information is of a timely nature. Investing in Open Markets involves a great deal of risk, including the loss of all or a portion of your investment, as well as emotional distress. All risks, losses and costs associated with investing, including total loss of principal, are your responsibility. The views and opinions expressed in this article are those of the authors and do not necessarily reflect the official policy or position of FXStreet nor its advertisers. The author will not be held responsible for information that is found at the end of links posted on this page.

If not otherwise explicitly mentioned in the body of the article, at the time of writing, the author has no position in any stock mentioned in this article and no business relationship with any company mentioned. The author has not received compensation for writing this article, other than from FXStreet.

FXStreet and the author do not provide personalized recommendations. The author makes no representations as to the accuracy, completeness, or suitability of this information. FXStreet and the author will not be liable for any errors, omissions or any losses, injuries or damages arising from this information and its display or use. Errors and omissions excepted.

The author and FXStreet are not registered investment advisors and nothing in this article is intended to be investment advice.

Recommended content


Recommended content

Editors’ Picks

AUD/USD failed just ahead of the 200-day SMA

AUD/USD failed just ahead of the 200-day SMA

Finally, AUD/USD managed to break above the 0.6500 barrier on Wednesday, extending the weekly recovery, although its advance faltered just ahead of the 0.6530 region, where the key 200-day SMA sits.

AUD/USD News

EUR/USD met some decent resistance above 1.0700

EUR/USD met some decent resistance above 1.0700

EUR/USD remained unable to gather extra upside traction and surpass the 1.0700 hurdle in a convincing fashion on Wednesday, instead giving away part of the weekly gains against the backdrop of a decent bounce in the Dollar.

EUR/USD News

Gold keeps consolidating ahead of US first-tier figures

Gold keeps consolidating ahead of US first-tier figures

Gold finds it difficult to stage a rebound midweek following Monday's sharp decline but manages to hold above $2,300. The benchmark 10-year US Treasury bond yield stays in the green above 4.6% after US data, not allowing the pair to turn north.

Gold News

Bitcoin price could be primed for correction as bearish activity grows near $66K area

Bitcoin price could be primed for correction as bearish activity grows near $66K area

Bitcoin (BTC) price managed to maintain a northbound trajectory after the April 20 halving, despite bold assertions by analysts that the event would be a “sell the news” situation. However, after four days of strength, the tables could be turning as a dark cloud now hovers above BTC price.

Read more

Bank of Japan's predicament: The BOJ is trapped

Bank of Japan's predicament: The BOJ is trapped

In this special edition of TradeGATEHub Live Trading, we're joined by guest speaker Tavi @TaviCosta, who shares his insights on the Bank of Japan's current predicament, stating, 'The BOJ is Trapped.' 

Read more

Forex MAJORS

Cryptocurrencies

Signatures