GBP/USD carving out a bull flag ahead of BOE Super Thursday


  • GBP/USD extends Tuesday’s bounce above 1.3900 amid weaker US dollar.
  • The cable carves out a bull flag formation on the daily sticks.
  • UK/ US PMIs eyed, BOE decision and US NFP could yield an upside break.

GBP/USD is heading towards July highs at 1.3985, extending its bounce from near the 1.3875 region

The bulls remain in control above 1.3900 amid a broadly softer US dollar, divided between looming coronavirus worries, progress on US infrastructure bill and dovish Fed expectations.

On the GBP side of the equation, falling covid cases in the UK and its relative success in the vaccination campaigns underpin the pound.

Meanwhile, the GBP bulls also cheer the Brexit optimism, especially after the European Union (EU) has backed off a threat of imminent legal action against the UK over breaches of the Northern Ireland (NI) protocol of the Brexit agreement as the two sides try to work through their differences.

BOE in focus

The immediate focus is now on the US ADP and ISM Services PMI data while the UK Final Services PMI could also offer some trading incentives to the pair. However, the main event risks for the cable are the BOE ‘Super Thursday’ and Friday’s NFP report.

The UK central bank is likely to maintain its monetary policy settings while the focus will be on the economic forecasts, with rising concerns on inflation, which may prompt the BOE to hint at tapering sooner than expected. However, amidst ongoing certainty over the economic recovery, in light of the Delta covid variant flareups, the central bank could refrain from offering any hawkish signals.

GBP/USD technical outlook

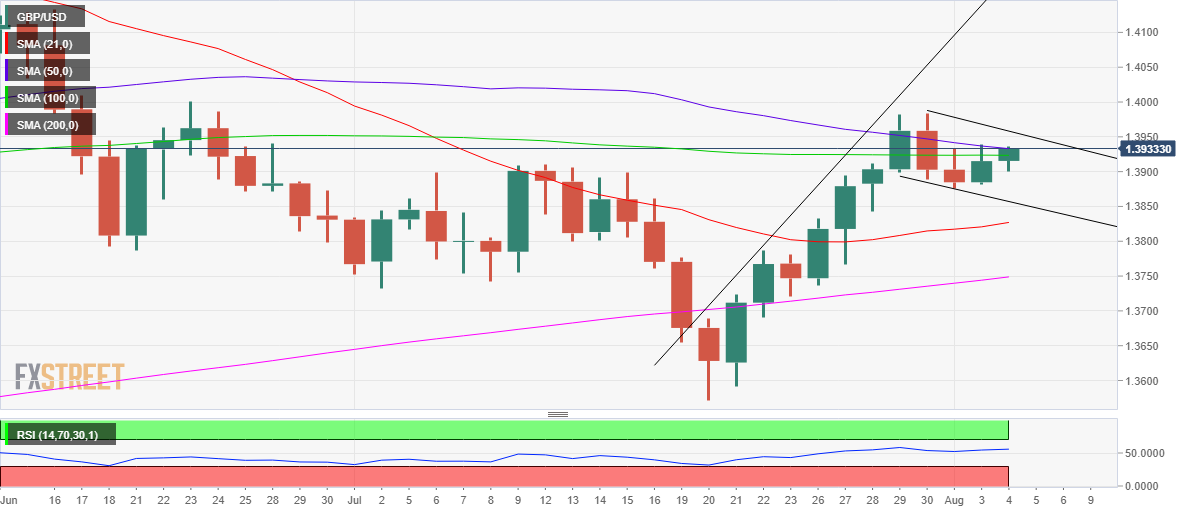
With the recent rally that followed a brief consolidative mode, GBP/USD price has taken the shape of a bull flag.

The upcoming events are likely to determine whether the cable will yield the upside breakout from the bullish continuation formation or lead to a pattern failure.

GBP bulls need a firm break above the falling trendline resistance at 1.3958 for the bull flag validation.

Meanwhile, acceptance below the falling trendline support at 1.3857 will revive the bearish interests, with the corrective downside to resume towards the 21-Daily Moving Average (DMA) at 1.3826

The 14-day Relative Strength Index (RSI) is pointing north above the midline, supporting the potential move higher.

GBP/USD daily chart

GBP/USD additional levels to watch

GBP/USD

Overview
Today last price 1.3927
Today Daily Change 0.0012
Today Daily Change % 0.09
Today daily open 1.3915
 
Trends
Daily SMA20 1.3822
Daily SMA50 1.3937
Daily SMA100 1.3924
Daily SMA200 1.3744
 
Levels
Previous Daily High 1.3939
Previous Daily Low 1.3882
Previous Weekly High 1.3984
Previous Weekly Low 1.3737
Previous Monthly High 1.3984
Previous Monthly Low 1.3572
Daily Fibonacci 38.2% 1.3917
Daily Fibonacci 61.8% 1.3903
Daily Pivot Point S1 1.3885
Daily Pivot Point S2 1.3855
Daily Pivot Point S3 1.3828
Daily Pivot Point R1 1.3942
Daily Pivot Point R2 1.3969
Daily Pivot Point R3 1.3999


Share: Feed news

Information on these pages contains forward-looking statements that involve risks and uncertainties. Markets and instruments profiled on this page are for informational purposes only and should not in any way come across as a recommendation to buy or sell in these assets. You should do your own thorough research before making any investment decisions. FXStreet does not in any way guarantee that this information is free from mistakes, errors, or material misstatements. It also does not guarantee that this information is of a timely nature. Investing in Open Markets involves a great deal of risk, including the loss of all or a portion of your investment, as well as emotional distress. All risks, losses and costs associated with investing, including total loss of principal, are your responsibility. The views and opinions expressed in this article are those of the authors and do not necessarily reflect the official policy or position of FXStreet nor its advertisers. The author will not be held responsible for information that is found at the end of links posted on this page.

If not otherwise explicitly mentioned in the body of the article, at the time of writing, the author has no position in any stock mentioned in this article and no business relationship with any company mentioned. The author has not received compensation for writing this article, other than from FXStreet.

FXStreet and the author do not provide personalized recommendations. The author makes no representations as to the accuracy, completeness, or suitability of this information. FXStreet and the author will not be liable for any errors, omissions or any losses, injuries or damages arising from this information and its display or use. Errors and omissions excepted.

The author and FXStreet are not registered investment advisors and nothing in this article is intended to be investment advice.

Recommended content


Recommended content

Editors’ Picks

EUR/USD climbs to 10-day highs above 1.0700

EUR/USD climbs to 10-day highs above 1.0700

EUR/USD gained traction and rose to its highest level in over a week above 1.0700 in the American session on Tuesday. The renewed US Dollar weakness following the disappointing PMI data helps the pair stretch higher.

EUR/USD News

GBP/USD extends recovery beyond 1.2400 on broad USD weakness

GBP/USD extends recovery beyond 1.2400 on broad USD weakness

GBP/USD gathered bullish momentum and extended its daily rebound toward 1.2450 in the second half of the day. The US Dollar came under heavy selling pressure after weaker-than-forecast PMI data and fueled the pair's rally. 

GBP/USD News

Gold rebounds to $2,320 as US yields turn south

Gold rebounds to $2,320 as US yields turn south

Gold reversed its direction and rose to the $2,320 area, erasing a large portion of its daily losses in the process. The benchmark 10-year US Treasury bond yield stays in the red below 4.6% following the weak US PMI data and supports XAU/USD.

Gold News

Here’s why Ondo price hit new ATH amid bearish market outlook Premium

Here’s why Ondo price hit new ATH amid bearish market outlook

Ondo price shows no signs of slowing down after setting up an all-time high (ATH) at $1.05 on March 31. This development is likely to be followed by a correction and ATH but not necessarily in that order.

Read more

Germany’s economic come back

Germany’s economic come back

Germany is the sick man of Europe no more. Thanks to its service sector, it now appears that it will exit recession, and the economic future could be bright. The PMI data for April surprised on the upside for Germany, led by the service sector.

Read more

Forex MAJORS

Cryptocurrencies

Signatures