GBP/JPY Technical Analysis: Break of eight-day-old trendline, bearish MACD attract sellers
- GBP/JPY seesaws around 23.6% Fibonacci retracement amid bearish MACD.
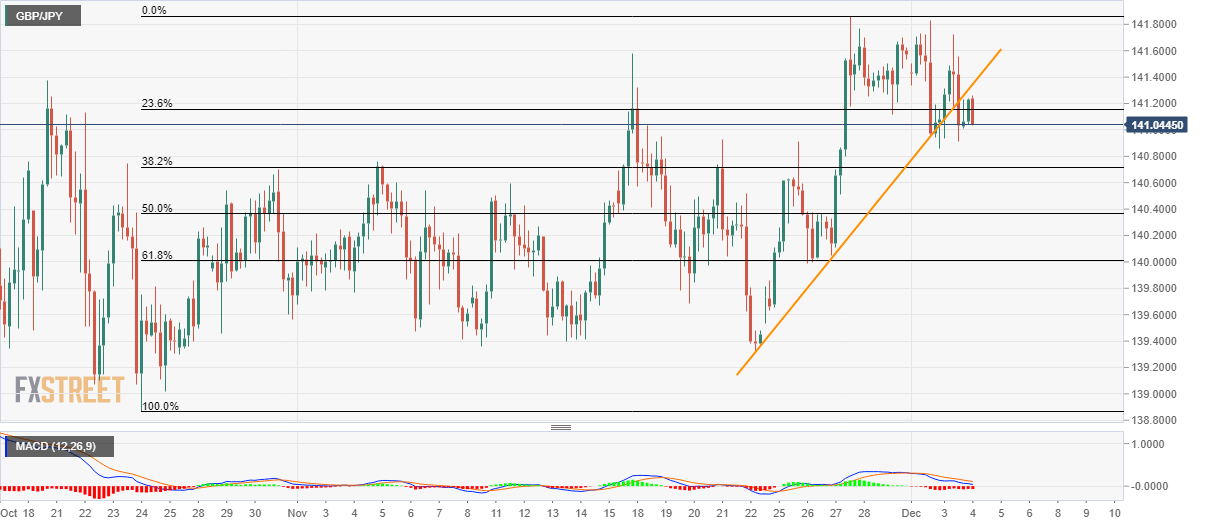
- 140.70 and 61.8% Fibonacci retracement hold the keys to November month low.

Following the break of the multi-day-old trend line, GBP/JPY declines to 141.15 by the press time of the Asian session on Wednesday.
The pair now aims to revisit 140.75/70 multiple support zone that comprises 38.2% Fibonacci retracement of late-October to late-November fall. Supporting the move are bearish signals from 12-bar Moving Average Convergence and Divergence (MACD) indicator.
Should the quote drops beneath 140.70, 61.8% Fibonacci retracement around 14.00 round-figure and November month bottom near 139.30 will be on sellers’ radar.
Alternatively, buyers will look for entry beyond the support-turned-resistance, at 141.35. In doing so, 141.70 and 141.85/90 could flash on their watch-list.
During the pair’s run-up beyond 141.90, Bulls will prepare to confront March/April lows close to 143.72/80.
GBP/JPY four-hour chart
Trend: Pullback expected
Author

Anil Panchal
FXStreet
Anil Panchal has nearly 15 years of experience in tracking financial markets. With a keen interest in macroeconomics, Anil aptly tracks global news/updates and stays well-informed about the global financial moves and their implications.


