GBP/JPY Price Forecast: Rebounds above 201.00 but upside limited
- GBP/JPY rises 0.53% as buyers defend key support, holding near recent highs.
- RSI below 50 signals fading bullish momentum and growing downside risk.
- Break below support exposes 199.60–197.50 zone; recovery above 202.00 needed to retest resistance area.

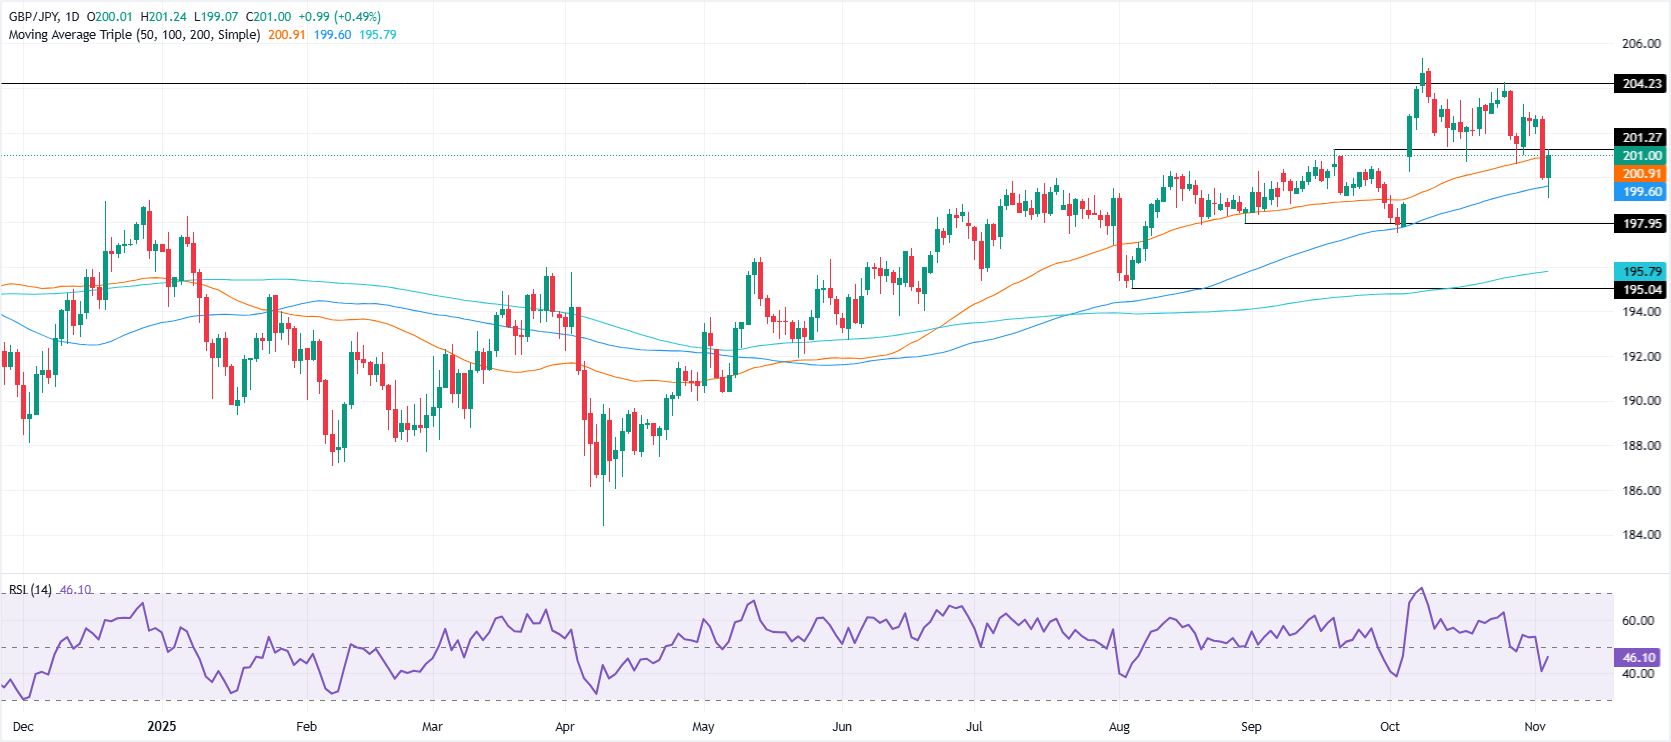
The GBP/JPY shows signs of recovery on Wednesday, trades above the 50-day Simple Moving Average (SMA) of 200.97, after hitting a daily low of 199.61 earlier in the session. At the time of writing, the pair trades at 201.10, up 0.53%.
GBP/JPY Price Forecast: Technical outlook
The GBP/JPY seems poised to consolidate further below 202.00 unless buyers gain momentum, which seem far from happening as shown by the Relative Strength Index (RSI).
The RSI is edging further below its 50 neutral level an indication that bears are stepping in.
If GBP/JPY tumbles below 201.00 the next support would be 199.61 ahead of the October 2 low of 197.49. Once surpassed, the next stop would be the 200-day SMA at 195.85.
Conversely if GBP/JPY recovers above 202.00, the next resistance will be the 20-day SMA At 202.32. A breach of the latter will expose 203.00, followed by the 204.00 milestone.
GBP/JPY Price Chart – Daily
Pound Sterling Price This week
The table below shows the percentage change of British Pound (GBP) against listed major currencies this week. British Pound was the strongest against the New Zealand Dollar.
| USD | EUR | GBP | JPY | CAD | AUD | NZD | CHF | |
|---|---|---|---|---|---|---|---|---|
| USD | 0.34% | 0.67% | 0.00% | 0.66% | 0.65% | 1.17% | 0.71% | |
| EUR | -0.34% | 0.32% | -0.25% | 0.32% | 0.30% | 0.83% | 0.37% | |
| GBP | -0.67% | -0.32% | -0.74% | -0.01% | -0.04% | 0.50% | 0.04% | |
| JPY | 0.00% | 0.25% | 0.74% | 0.64% | 0.62% | 1.15% | 0.83% | |
| CAD | -0.66% | -0.32% | 0.01% | -0.64% | -0.07% | 0.48% | 0.05% | |
| AUD | -0.65% | -0.30% | 0.04% | -0.62% | 0.07% | 0.54% | 0.08% | |
| NZD | -1.17% | -0.83% | -0.50% | -1.15% | -0.48% | -0.54% | -0.45% | |
| CHF | -0.71% | -0.37% | -0.04% | -0.83% | -0.05% | -0.08% | 0.45% |
The heat map shows percentage changes of major currencies against each other. The base currency is picked from the left column, while the quote currency is picked from the top row. For example, if you pick the British Pound from the left column and move along the horizontal line to the US Dollar, the percentage change displayed in the box will represent GBP (base)/USD (quote).
Author

Christian Borjon Valencia
FXStreet
Markets analyst, news editor, and trading instructor with over 14 years of experience across FX, commodities, US equity indices, and global macro markets.

















