GBP/JPY Price Forecast: Pound’s rally stalls below 205.00
- The Pound edges lower on Thursday after failing to consolidate above 205.00.
- The broader trend remains bullish, with the Yen battered amid expectations of a looser fiscal policy in Japan.
- GBP/JPY looks set for a bearish correction, targeting 203.00 and 202.10

The British Pound appreciated nearly 3% this week, but the rally seems to be losing momentum on Thursday. The pair has failed to consolidate above 20500 and technical indicators are turning lower, suggesting a potential correction.
The Pound surged on Yen weakness as the victory of Sanae Takaichi in the ruling party’s elections over the weekend, boosted speculation of a looser fiscal policy and dampened expectations of immediate BoJ tightening
Technical analysis: A bearish correction might be ahead
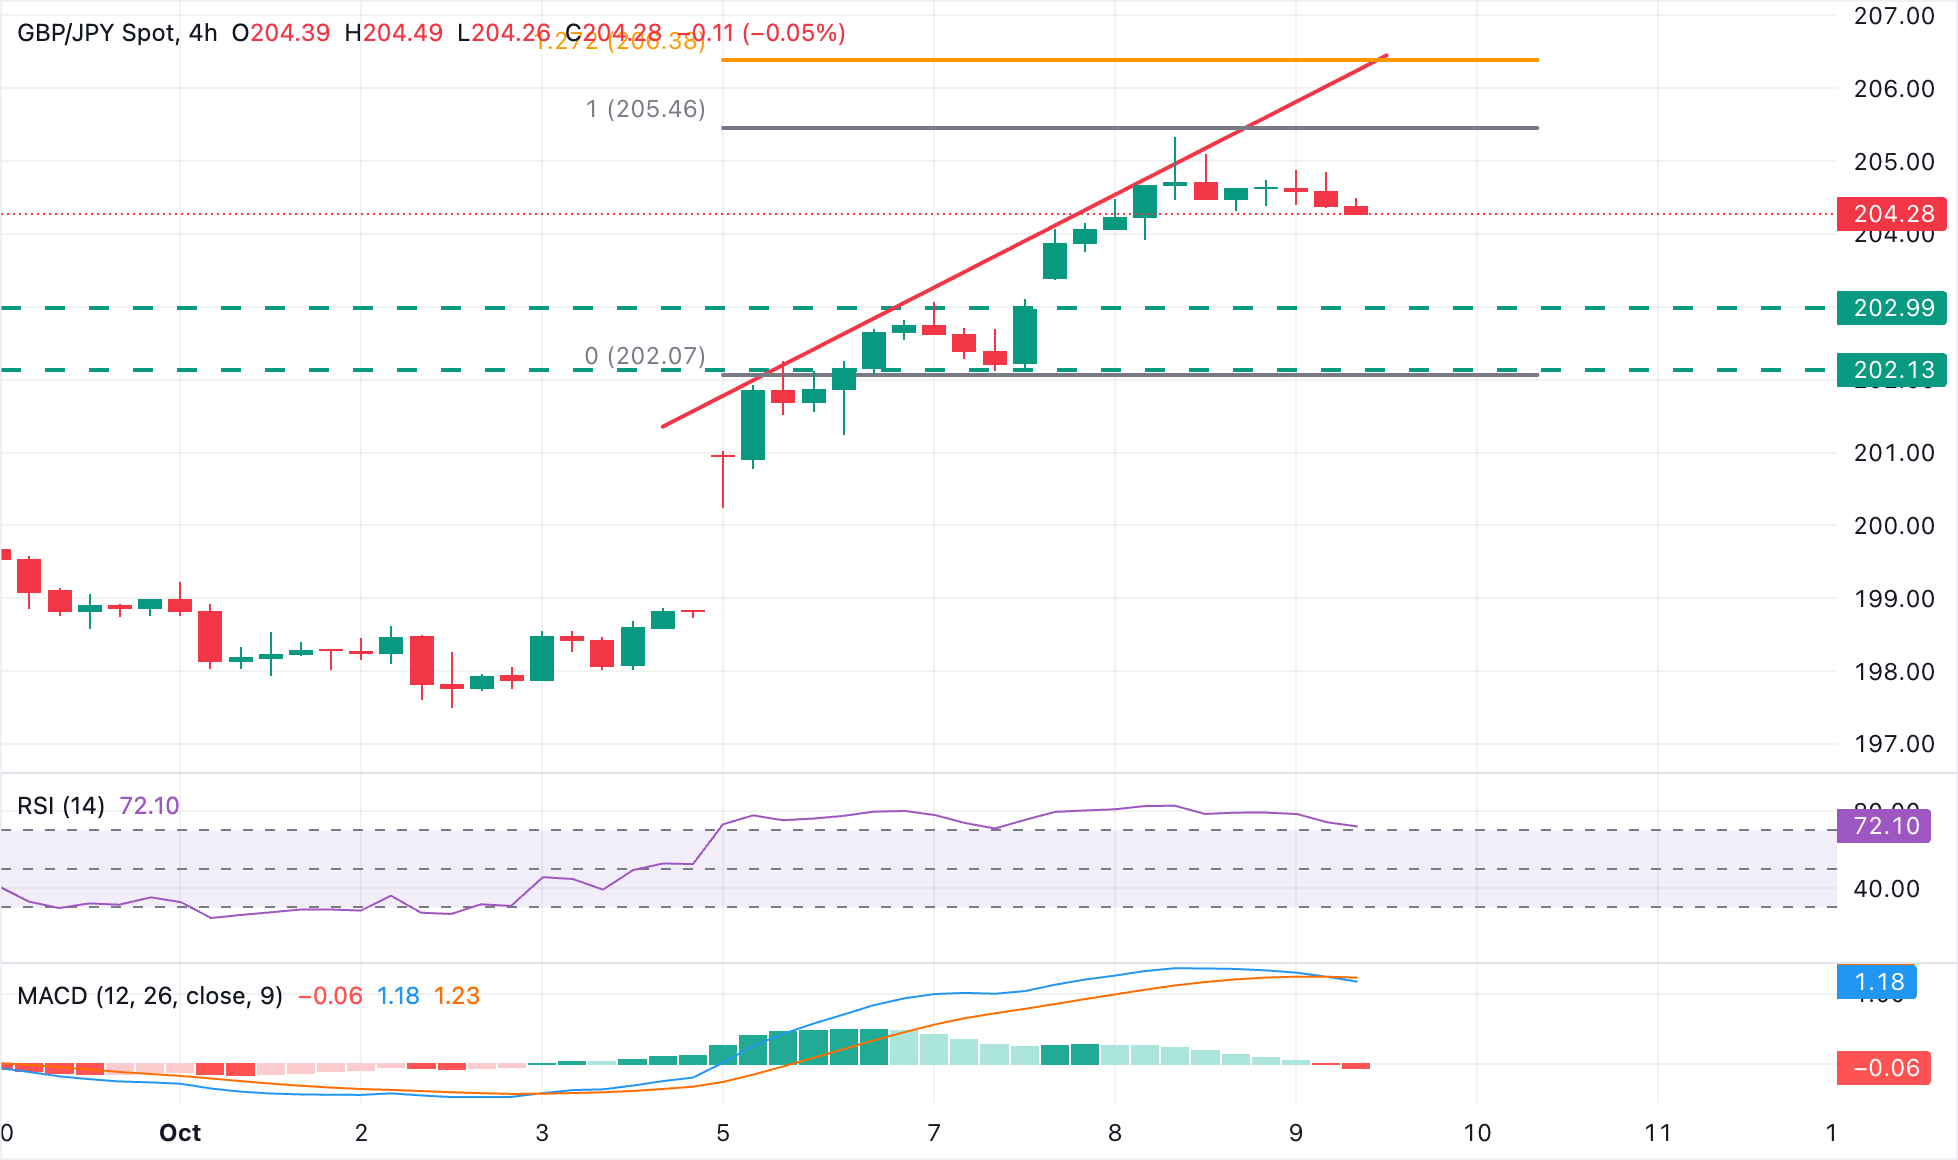
The technical picture shows all the ingredients for a bearish correction. The pair has reached strongly overbought levels at most timeframes, and the 4-Hour Moving Average Convergence Divergence (MACD) has crossed below the signal line, suggesting an increasing bearish pressure.
Bears are pushing against the intraday highs of 204.34 at the time of writing. Further down, the intra-day high at the 203.00 area, and the October 7 low, near 202.10, emerge as the next bearish targets.
To the upside, immediate resistance is at Wednesday’s high of 205.35. Trendline resistance is at 206.15, and the 161.8% Fibonacci retracement of the October 7 - 8 rally is at 207.56.
Japanese Yen Price Today
The table below shows the percentage change of Japanese Yen (JPY) against listed major currencies today. Japanese Yen was the strongest against the British Pound.
| USD | EUR | GBP | JPY | CAD | AUD | NZD | CHF | |
|---|---|---|---|---|---|---|---|---|
| USD | 0.23% | 0.44% | 0.28% | 0.06% | 0.12% | 0.45% | 0.29% | |
| EUR | -0.23% | 0.22% | 0.07% | -0.20% | 0.03% | 0.24% | -0.07% | |
| GBP | -0.44% | -0.22% | -0.18% | -0.38% | -0.20% | 0.06% | -0.23% | |
| JPY | -0.28% | -0.07% | 0.18% | -0.31% | -0.06% | 0.13% | -0.05% | |
| CAD | -0.06% | 0.20% | 0.38% | 0.31% | 0.14% | 0.41% | 0.11% | |
| AUD | -0.12% | -0.03% | 0.20% | 0.06% | -0.14% | 0.29% | -0.11% | |
| NZD | -0.45% | -0.24% | -0.06% | -0.13% | -0.41% | -0.29% | -0.29% | |
| CHF | -0.29% | 0.07% | 0.23% | 0.05% | -0.11% | 0.11% | 0.29% |
The heat map shows percentage changes of major currencies against each other. The base currency is picked from the left column, while the quote currency is picked from the top row. For example, if you pick the Japanese Yen from the left column and move along the horizontal line to the US Dollar, the percentage change displayed in the box will represent JPY (base)/USD (quote).
Author

Guillermo Alcala
FXStreet
Graduated in Communication Sciences at the Universidad del Pais Vasco and Universiteit van Amsterdam, Guillermo has been working as financial news editor and copywriter in diverse Forex-related firms, like FXStreet and Kantox.