GBP/JPY Price Forecast: Pound found resistance at 207.35 area
- Pound rally against the Yen stalled this week below the 207.35 resistance area.
- FX intervention threats from Japanese authorities have provided some support to the Yen.
- GBP/JPY price action is forming an ascending triangle pattern.

The Pound is in a positive trend against the Yen. The pair has rallied about 3.5% from early November lows, although the rally has stalled this week, with bulls failing to find follow-through beyond the 2076.35 area.
The fundamental context has been mixed. On the one hand, investors have been relieved by the tax-raising UK budget and the positive services activity figures released on Wednesday.
On the other hand, the reiterating warnings of Japanese officials against excessive Yen weakness have kept Yen sellers on their toes. Earlier today, it was Cabinet Secretary Minoru Kihara who pledged to take the appropriate steps to protect the Yen against excessive and disorderly volatility.
Technical analysis: GBP/JPY is forming an ascending triangle below 207.35
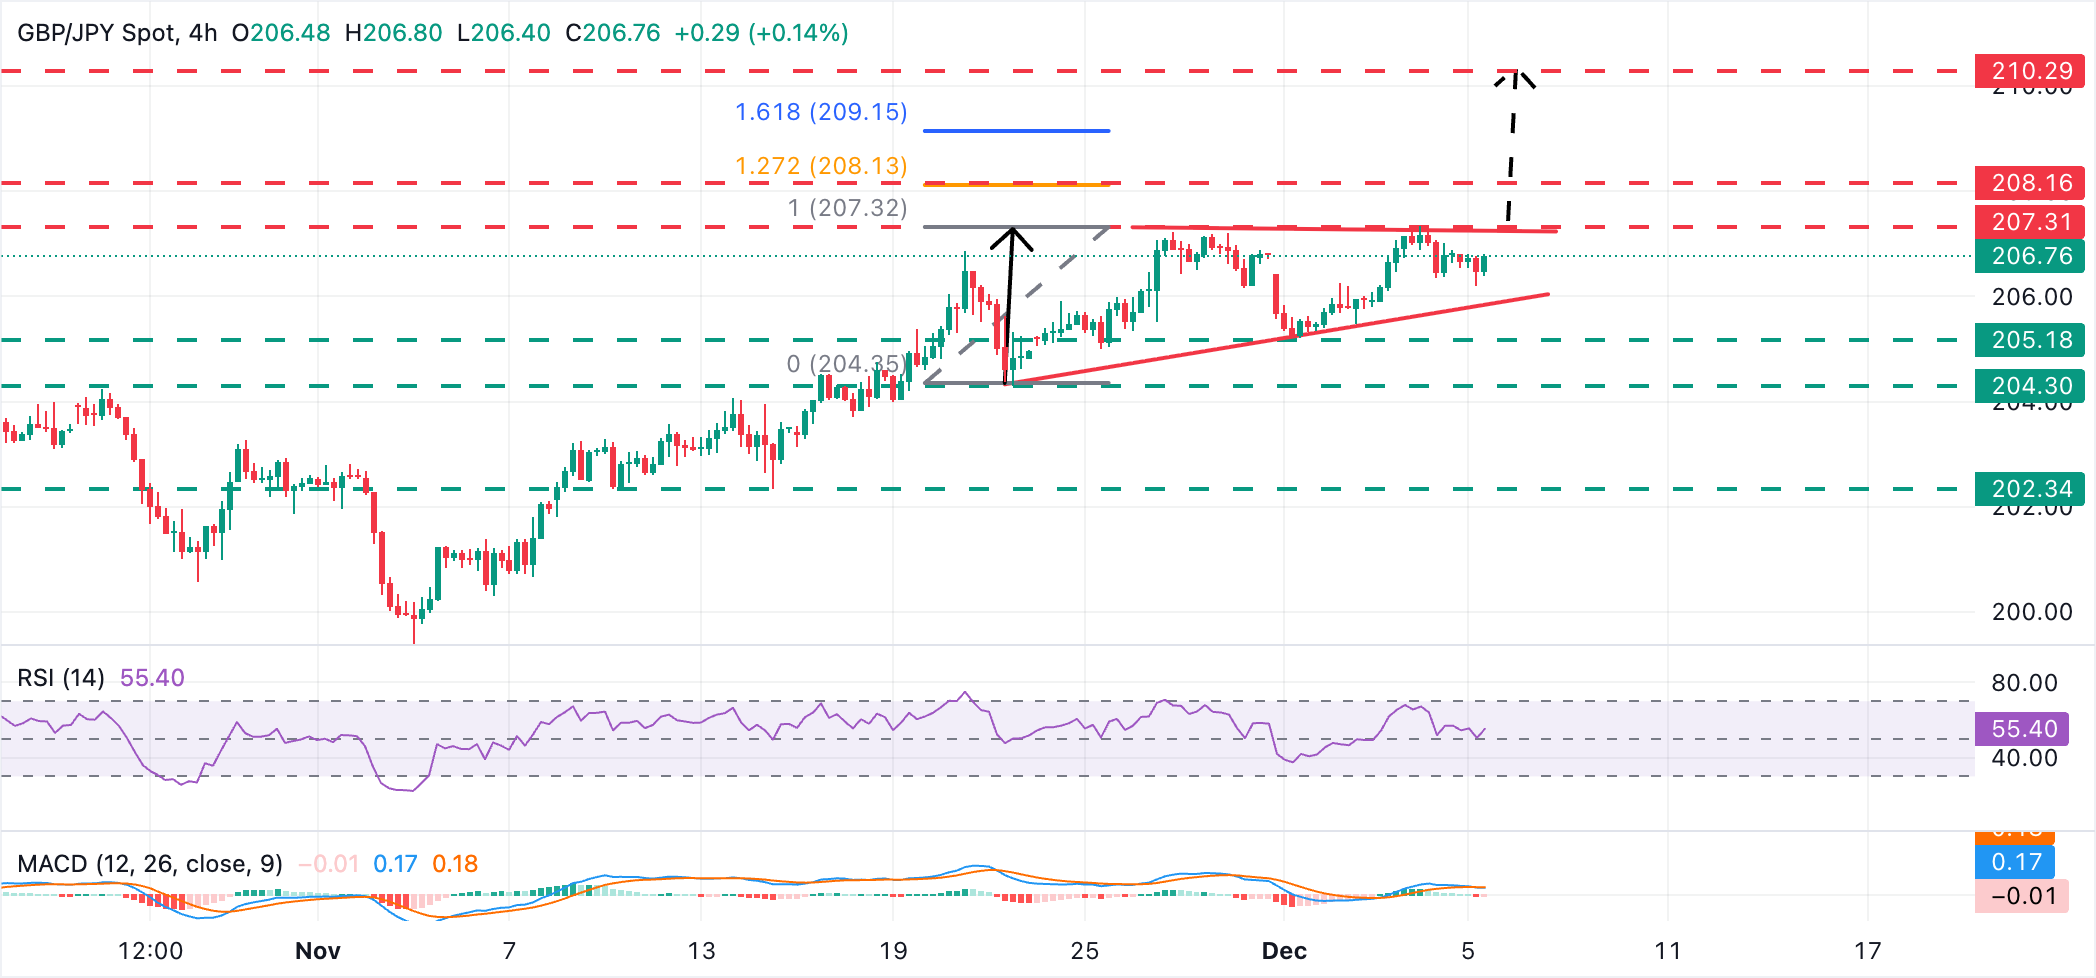
Recent price action shows the pair moving within an ascending triangle, with its top at the mentioned 207.35 level. Triangles are often continuation patterns, and in this case, it would point to a bullish outcome.
On the upside, above the mentioned 207.35 level, the target is the 2024 peak, which coincides with the 127.2% Fibonacci extension of the November 20-26 rally at the 208.15 area. Further up, the 161.8% extension of the same cycle is at 209.15. The triangle’s measured target is at 210.30.
A bearish reaction, on the other hand, would find support at the base of the triangle, now at the 205.85 area ahead of the intraweek low of 205.20 and the November 21 low, at 204.30.
Japanese Yen Price This week
The table below shows the percentage change of Japanese Yen (JPY) against listed major currencies this week. Japanese Yen was the strongest against the US Dollar.
| USD | EUR | GBP | JPY | CAD | AUD | NZD | CHF | |
|---|---|---|---|---|---|---|---|---|
| USD | -0.48% | -0.83% | -0.79% | -0.23% | -1.19% | -0.69% | -0.03% | |
| EUR | 0.48% | -0.35% | -0.32% | 0.25% | -0.71% | -0.21% | 0.45% | |
| GBP | 0.83% | 0.35% | 0.31% | 0.61% | -0.36% | 0.14% | 0.80% | |
| JPY | 0.79% | 0.32% | -0.31% | 0.56% | -0.42% | 0.09% | 0.75% | |
| CAD | 0.23% | -0.25% | -0.61% | -0.56% | -1.01% | -0.45% | 0.19% | |
| AUD | 1.19% | 0.71% | 0.36% | 0.42% | 1.01% | 0.51% | 1.17% | |
| NZD | 0.69% | 0.21% | -0.14% | -0.09% | 0.45% | -0.51% | 0.66% | |
| CHF | 0.03% | -0.45% | -0.80% | -0.75% | -0.19% | -1.17% | -0.66% |
The heat map shows percentage changes of major currencies against each other. The base currency is picked from the left column, while the quote currency is picked from the top row. For example, if you pick the Japanese Yen from the left column and move along the horizontal line to the US Dollar, the percentage change displayed in the box will represent JPY (base)/USD (quote).
Author

Guillermo Alcala
FXStreet
Graduated in Communication Sciences at the Universidad del Pais Vasco and Universiteit van Amsterdam, Guillermo has been working as financial news editor and copywriter in diverse Forex-related firms, like FXStreet and Kantox.


